
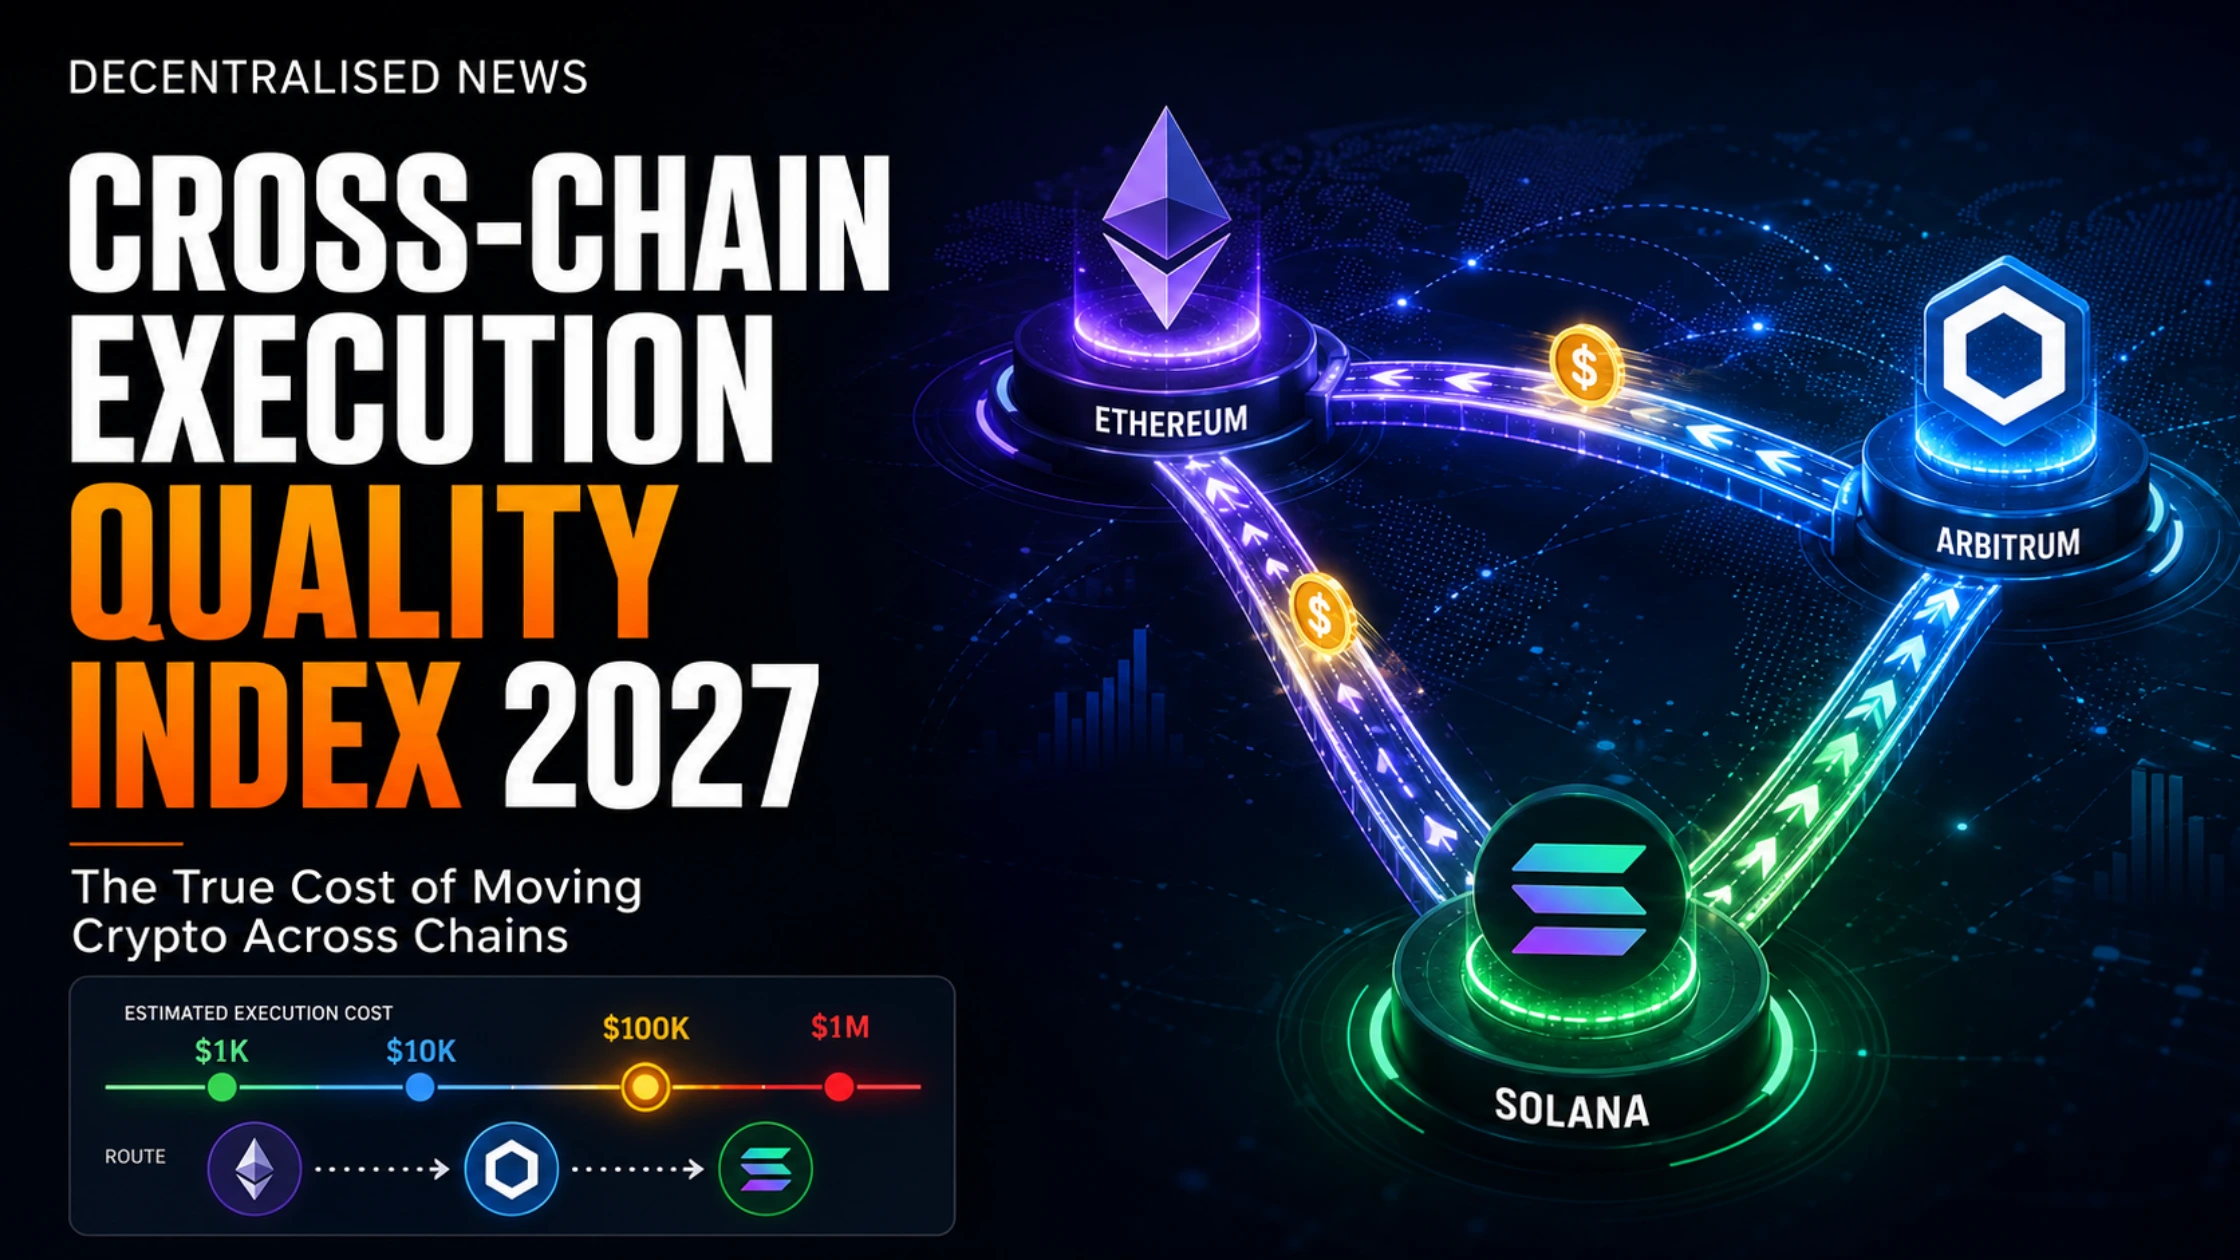
The DN Cross-Chain Execution Quality Index measures the real cost of moving $1K, $10K, $100K and $1M across blockchains, including bridge fees, gas, slippage, latency, quote decay and failure recovery.
Data reviewed: 1 September 2026
Methodology: DN-CEQI v1.0
Affiliate disclosure: Decentralised News may receive compensation when eligible readers use certain partner links in this article. Commercial relationships do not determine inclusion, methodology, scoring or conclusions.
Summary
The cheapest cross-chain route is not necessarily the bridge advertising the lowest fee.
The DN Cross-Chain Execution Quality Index measures the complete economic cost of moving capital between blockchains, including source gas, bridge and solver fees, origin and destination slippage, destination gas, quote deterioration, latency and expected recovery costs.
The central DN metric is:
Failure-Adjusted All-In Cross-Chain Cost = Direct Execution Cost + Latency Cost + Expected Recovery Cost
The benchmark measures routes at $1,000, $10,000, $100,000 and $1 million, because fixed gas costs dominate smaller transfers while percentage fees, liquidity and execution quality increasingly determine large-transfer economics.
Key Findings
- Bridge fee is not total cross-chain cost. A route can advertise a tiny protocol fee while losing more money through swaps, gas, price impact or recovery friction.
- Trade size radically changes route economics. A $5 fixed cost equals 50 basis points on a $1,000 transfer but only 0.05 basis points on $1 million.
- Same-token bridges and cross-chain swaps should not be ranked together. Swapping ETH on Ethereum into USDC on Solana has materially different execution risk from moving USDC from Arbitrum to Base.
- Fastest does not automatically mean cheapest. Some architectures explicitly let users trade speed for cost.
- Destination usability matters. Receiving an asset is not economically equivalent to receiving the exact desired asset with sufficient gas to use it.
- Failure recovery is an execution cost. Refunding automatically after several hours is economically different from requiring a manual destination-chain transaction or support intervention.
- Cross-chain transactions are often not fully atomic. A bridge leg may complete while a destination swap fails, producing a partial result rather than returning the entire transaction to its original state. LI.FI explicitly documents this possibility.
- Quotes must be measured at execution time. Liquidity, gas and solver economics change dynamically. Across explicitly advises retrieving fresh fees, while deBridge documentation warns that costs and quote economics can change with market conditions.
- No protocol is declared the empirical winner in DN-CEQI v1.0. The methodology is being published before the live leaderboard so results can subsequently be reproduced rather than retrofitted around a preferred conclusion.
The Wrong Question Is: “Which Crypto Bridge Has the Lowest Fee?”
Imagine two routes for moving $100,000.
Route A
Advertised bridge fee:
$8
Final economic cost after gas, swaps and price deterioration:
$103
Route B
Advertised bridge fee:
$22
Final economic cost:
$61
Which was cheaper?
Route B.
Yet a conventional fee-comparison article could easily rank Route A first.
That is the problem the DN Cross-Chain Execution Quality Index 2027 is designed to solve.
Instead of asking:
Which bridge advertises the lowest fee?
DN asks:
How much economically usable value arrives on the destination blockchain, how long does it take, and what happens when the route does not complete normally?
What Is Cross-Chain Execution Quality?
Cross-chain execution quality describes the economic difference between:
what you start with on Chain A
and
what is actually usable on Chain B.
That difference may include considerably more than a bridge fee.
A cross-chain route can contain:
Wallet
↓
Source-chain approval
↓
Source swap
↓
Bridge or intent
↓
Relayer / solver / liquidity network
↓
Destination settlement
↓
Destination swap
↓
Gas top-up
↓
Final usable asset
Each step introduces a potential cost or delay.
A single headline fee cannot describe that execution chain.
The DN Definition of “Usable Destination Value”
This article introduces a deliberately stricter concept:
Usable Destination Value
The fair USD value of the asset the user can actually deploy, transfer or trade after the complete intended cross-chain route has finished.
This distinction is important.
Suppose a user wants:
ETH on Arbitrum → SOL on Solana
The bridge delivers USDC to Solana, but the final SOL swap fails.
The user’s funds may be safe.
The bridge may technically have succeeded.
But the intended transaction has not produced the requested usable destination asset.
LI.FI’s current documentation explicitly recognises these outcomes through statuses such as DONE / PARTIAL, where value reaches the destination but the exact intended token may not.
DN therefore refuses to treat:
funds not lost
as synonymous with:
execution completed exactly as requested.
The DN Cross-Chain Cost Stack
The Index separates cross-chain friction into eight components.
Cost Component | What DN Measures |
Source Gas | Approval and origin-chain execution |
Bridge / Solver Cost | Protocol, LP, relayer, solver and messaging economics |
Origin Slippage | Loss during any pre-bridge conversion |
Destination Slippage | Loss during any post-bridge conversion |
Destination Gas | Gas paid or economically deducted for destination execution |
Integrator / App Fee | Additional routing or application fee |
Latency Cost | Economic value of capital being unavailable during settlement |
Recovery Cost | Expected economic burden of failed, partial or refunded routes |
These are measured separately before being combined.
The DN All-In Cross-Chain Cost
For component-level analysis:
Direct Cross-Chain Cost
DCC = SG + BF + OS + DS + DG + AF + QD
Where:
SG = source gas
BF = bridge / solver / relayer fees
OS = origin swap loss
DS = destination swap loss
DG = destination gas not already embedded
AF = application / integrator fees
QD = adverse quote deterioration
Then:
Latency Cost
LC = Capital × Opportunity Cost Per Hour × Settlement Hours
And:
Expected Recovery Cost
ERC = P(Failure) × (Recovery Spend + Recovery Delay Cost)
Finally:
DN Failure-Adjusted All-In Cost
FAIC = DCC + LC + ERC
Expressed in basis points:
FAIC bps = FAIC ÷ Transfer Value × 10,000
This is one of the primary metrics in DN-CEQI.
A Second Method Prevents Double Counting
Cross-chain APIs frequently embed several costs inside the quoted output.
Adding every displayed fee again can therefore exaggerate the real cost.
For live benchmarking, DN uses a second method as the authoritative economic check.
DN Delivered Value Method
All-In Economic Loss = Origin Fair Value + Externally Paid Costs − Destination Usable Fair Value
Suppose:
Origin value:
$100,000
Destination usable value:
$99,940
Gas paid outside the quoted amount:
$7
Then:
Total economic loss = $67
or:
6.7 basis points
This method captures what actually matters to the user.
The component model explains why the $67 disappeared.
The delivered-value model verifies how much disappeared.
Using both prevents misleading accounting.
Why $1K, $10K, $100K and $1M Must Be Tested Separately
A bridge ranking that tests only one transfer size can be nearly meaningless.
Consider a fixed $2 cost.
Transfer | $2 Fixed Cost in Basis Points |
$1,000 | 20.00 bps |
$10,000 | 2.00 bps |
$100,000 | 0.20 bps |
$1,000,000 | 0.02 bps |
Now consider a variable 10 basis-point execution cost.
Transfer | 10 bps Economic Cost |
$1,000 | $1 |
$10,000 | $10 |
$100,000 | $100 |
$1,000,000 | $1,000 |
The winner can therefore change as order size increases.
For a small transaction, avoiding Ethereum gas might matter most.
For a $1 million transaction, saving three basis points of route deterioration represents:
$300
The marginal importance of a $2 transaction fee becomes almost irrelevant.
DN Size Elasticity
This leads to another proprietary measurement.
Cross-Chain Cost Elasticity
DN measures how rapidly a route’s total basis-point cost changes as transaction size increases.
A route dominated by fixed fees should become dramatically cheaper in basis-point terms as size increases.
A route dominated by:
- liquidity impact,
- solver margin,
- percentage protocol fees,
- DEX slippage,
may not.
This creates a useful classification.
Fixed-Cost Dominated
Often attractive for larger transfers.
Variable-Cost Dominated
Economic cost scales approximately with transfer value.
Liquidity-Curve Dominated
Costs may accelerate sharply once order size becomes large relative to available liquidity.
This last category is particularly important for the $100,000 and $1 million benchmarks.
Same-Asset Bridge vs Cross-Chain Swap
DN-CEQI will maintain separate cohorts.
Cohort A: Same-Asset Transfer
Example:
USDC on Arbitrum → USDC on Base
This primarily tests:
- bridge fee
- gas
- settlement speed
- liquidity
- failure recovery
Cohort B: Cross-Asset Transfer
Example:
ETH on Ethereum → SOL on Solana
Now execution may require:
- source swap
- bridging
- destination swap
- multiple liquidity venues
- additional slippage
Cohort C: Bridge + Contract Action
Example:
USDC on Arbitrum → deposit into a lending vault on Base
Now execution quality includes whether the final contract call succeeds.
Cohort D: Canonical Bridge
Canonical withdrawal mechanisms can involve intentionally long settlement periods and should not be ranked directly against intent-based fast bridges without accounting for their fundamentally different security and settlement models.
DN Cross-Chain Benchmark Architecture
Every live test should record:
- Origin blockchain
- Destination blockchain
- Input asset
- Requested destination asset
- USD reference value
- Quote timestamp
- Source transaction timestamp
- Destination delivery timestamp
- Time to usable balance
- Expected output
- Minimum output
- Actual output
- Source gas
- Destination gas
- Protocol fee
- Solver / relayer fee
- Integrator fee
- Origin swap impact
- Destination swap impact
- Route path
- Underlying bridge
- Underlying DEX
- Quote-to-execution deviation
- Completion state
- Refund state
- Manual recovery requirement
- Recovery cost
- Recovery time
- Final usable destination value
The same methodology should then be repeated at:
$1K
$10K
$100K
$1M
where the route can realistically support the requested size.
A route that cannot return an executable $1 million quote should be recorded as:
NO EXECUTABLE ROUTE
rather than silently omitted.
That itself is valuable execution-quality information.
The Most Important Timing Metric: Time to Usable Funds
Cross-chain marketing often focuses on transaction speed.
DN measures something stricter:
Time to Usable Destination Balance
The clock begins when the origin transaction is successfully submitted or included according to the chosen benchmark definition.
It stops only once the intended destination asset can actually be used.
Why?
Because these are not equivalent:
USDC has arrived
and
the requested destination swap has finished successfully.
Likewise:
destination transaction exists
is not necessarily the same thing as:
funds are economically available to the user.
Median Speed Is Not Enough
DN should eventually report:
Median completion time
P75 completion time
P95 completion time
Maximum observed completion time
Why P95?
Because a route that usually finishes in three seconds but occasionally takes two hours creates a very different operational risk from one consistently completing in 15 seconds.
Average speed can hide the tail.
DN Recovery Burden
Most bridge rankings virtually ignore what happens when something goes wrong.
DN treats recovery as part of execution quality.
A transfer may result in:
Outcome 1: Completed
Exact intended asset arrives.
Outcome 2: Delayed
Correct asset arrives, but significantly later than expected.
Outcome 3: Partial
Value arrives, but in an intermediate or fallback asset.
Outcome 4: Automatic Refund
Funds return without user intervention.
Outcome 5: Manual Recovery
User must submit another transaction, claim funds or intervene on another chain.
Outcome 6: Support-Assisted Recovery
The route requires assistance from the bridge or aggregator.
Outcome 7: Irrecoverable
Funds cannot reasonably be recovered.
These are economically different outcomes.
LI.FI’s status system illustrates this complexity with COMPLETED, PARTIAL, REFUNDED, REFUND_IN_PROGRESS and several failure states. It also warns that protocol bugs, chain problems or incorrect transaction construction can still produce irrecoverable edge cases.
The DN Expected Recovery Cost
Suppose a route has:
Transfer value:
$100,000
Observed failure probability:
1%
Average direct recovery cost when failure occurs:
$12
Average recovery delay:
four hours
If the user’s capital opportunity cost is:
2 bps per hour
then conditional delay cost is:
8 bps × $100,000 = $80
Total recovery burden conditional on failure:
$92
Expected recovery cost:
1% × $92 = $0.92
That is:
0.092 basis points
It may appear small.
But if the failure probability rises, recovery requires days rather than hours, or the transaction involves an active arbitrage opportunity, the economics can change rapidly.
The calculator below allows readers to model their own assumptions rather than having DN pretend every user’s opportunity cost is identical.
deBridge DLN: Solver-Based Cross-Chain Execution
Operational status: LIVE
deBridge’s DLN uses a solver model rather than requiring a central liquidity pool. Current deBridge documentation describes the system as a 0-TVL architecture, with solvers maintaining their own destination-chain liquidity.
Its current DLN fee documentation identifies several different cost components.
The order-creation layer includes:
- a source-chain native flat fee,
- a 4 basis-point variable protocol fee,
- solver operating expenses,
- approximately 4 bps of recommended taker margin for market-order economics,
- possible pre-order swap slippage,
- possible destination pre-fill swap slippage.
deBridge specifically warns integrators not to hard-code these values because real costs should be queried dynamically at quote time.
That makes deBridge particularly suitable for DN-CEQI because its API exposes component-level costDetails, including protocol fee, taker margin, estimated operating expenses and pre/post-swap slippage.
Recovery characteristics
If a DLN order remains unfulfilled, it can be cancelled and the source-side funds released.
Current documentation says the original input and applicable protocol and affiliate fees are returned, although manual cancellation can require a transaction on the destination chain and cross-chain messaging costs.
This is an excellent example of why DN separates:
fund safety
from:
recovery friction.
A recoverable transaction can still impose time, gas and operational burden.
DN testing priority
Very high
deBridge provides a useful test of:
- solver spreads
- 0-TVL execution
- cross-EVM routing
- EVM/Solana routing
- large transaction execution
- recovery economics
Commercial partner: Decentralised News readers can access deBridge through the DN referral route embedded in the calculator below.
Across: Intent-Based Relayer Execution
Operational status: LIVE
Across currently describes its architecture as delivering cross-chain transfers through relayers that supply destination liquidity before later receiving reimbursement.
Its documentation breaks route economics into:
LP fee
plus:
relayer fee
with the latter incorporating:
- destination gas,
- capital opportunity cost,
- capital-at-risk compensation.
The API also exposes estimated fill time and route limits.
Across currently reports that most supported-chain transfers fill in roughly two seconds, although this is a protocol-reported figure rather than an independently measured DN result.
That distinction will remain explicit in the eventual leaderboard:
PLATFORM-REPORTED: ~2 seconds
is not the same as:
DN OBSERVED: 2.03 seconds
until DN has actually measured it.
Recovery characteristics
Across also illustrates why tail behaviour belongs in the benchmark.
If a deposit reaches its fill deadline without a relayer completing it, the route can enter a refund process.
Across documentation says refunds can require bundle settlement, a challenge period and canonical bridge processing, meaning a refund may take several hours, even though ordinary fills are typically much faster.
So the same system can have:
very low median fill latency
and
material refund latency in the tail.
A sophisticated execution-quality index should measure both.
Stargate V2: Speed vs Cost Is an Explicit Choice
Operational status: LIVE
Stargate V2 offers an unusually clear example of why speed cannot be analysed separately from cost.
For same-asset transfers, users can choose between two execution modes.
Taxi
Designed for immediate transfer.
Bus
Batches transactions to reduce gas costs but can require users to wait while the batch fills.
Stargate describes this directly as a trade-off between speed and gas efficiency.
Its interface also lets users choose routes based on objectives such as:
fastest
or
cheapest
and exposes slippage controls where applicable.
That makes a single statement like:
“Stargate costs X”
inadequate.
The relevant question becomes:
Which Stargate execution mode was used, for which route, at what transfer size and under what conditions?
LI.FI: An Aggregator Must Be Benchmarked Differently
Operational status: LIVE
LI.FI is not simply another underlying bridge.
It is an orchestration layer aggregating routing across multiple bridge and DEX systems.
As of the current review, LI.FI says it provides liquidity access across 60+ chains, integrating major bridges, DEXs and aggregators.
That introduces an important DN distinction.
Protocol Benchmark
Measures one underlying bridge.
Aggregator Benchmark
Measures the route-selection system deciding which bridge and DEX combination to use.
An aggregator could outperform any one bridge overall because it can choose among them.
Alternatively, an additional application fee could offset some routing improvement.
LI.FI’s current standard integration documentation says its default transaction fee is 25 basis points, although enterprise and negotiated arrangements can differ.
Therefore DN should record:
underlying route cost
and
aggregator-inclusive cost
separately.
Otherwise we cannot determine whether the routing layer created enough value to compensate for its own fee.
LI.FI Also Shows Why Partial Execution Must Be Measured
Cross-chain transactions are not necessarily atomic.
LI.FI explains that after a bridge step has completed, a later destination action cannot simply rewind the entire route.
If the final conversion fails, the system may leave the user with the safely delivered intermediate token and classify the result as PARTIAL.
This is financially preferable to losing funds.
But it still creates another cost:
Completion Cost
If a user intended to receive SOL but receives USDC instead, they may need to:
- obtain destination gas,
- perform another swap,
- pay another fee,
- absorb another spread,
- spend additional time.
DN includes those costs in the economic outcome.
Relay: Cross-Chain Intents With Explicit Fee Decomposition
Operational status: LIVE
Relay is another intent-based execution architecture.
Its current documentation describes cross-chain execution that can generally operate in a 1 to 10 second range, with relayers filling the intended destination action before later settling capital. That again is platform-reported performance, not yet a DN-observed statistic.
Relay’s fee documentation is particularly useful because it breaks potential costs into:
- execution fees,
- swap fees,
- Relay fees,
- application fees.
It separately identifies relayer service costs and relayer gas, and provides price-impact information for execution and swaps.
This is broadly aligned with the transparency DN wants from every route.
OKX DEX Bridge: Aggregating the Bridge Layer
Operational status: LIVE
OKX Web3’s current DEX interface includes a cross-chain bridge aggregator.
Its August 2026 documentation says the system aggregates liquidity across more than 30 public blockchains, 25 cross-chain bridges and 400 DEXs, using its routing technology to choose routes.
Users can also configure the cross-chain route and slippage rather than simply accepting one invisible route.
This makes OKX useful for DN’s aggregator cohort.
The appropriate research question is not:
Is OKX cheaper than Across?
because OKX may route through an underlying bridge.
The better question is:
Does the OKX routing layer consistently find a superior end-to-end route after all costs are included?
Its own documentation also confirms an important execution reality: network fees can still be incurred when an attempted blockchain transaction fails because validators have already processed the transaction.
Commercial partner: OKX Web3 is available through the Decentralised News partner route embedded below.
Architecture Comparison Before Live DN Measurements
Platform | DN Classification | Primary Execution Model | What Makes It Interesting |
deBridge DLN | Direct protocol | Solver / intent, 0-TVL | Transparent component costs and solver economics |
Across | Direct protocol | Relayer / intent | Fast-fill architecture and explicit relayer economics |
Stargate | Direct protocol | Omnichain liquidity / messaging | Explicit fast vs batched cost trade-off |
Relay | Direct protocol | Solver / intent | Cross-chain execution and detailed fee decomposition |
LI.FI | Aggregator | Multi-bridge + DEX routing | Route selection across many underlying venues |
OKX DEX Bridge | Aggregator | Multi-bridge routing | Consumer-facing bridge aggregation across many networks |
This is an architecture comparison, not an empirical ranking.
DN will not fabricate performance numbers where observations have not yet been collected.
What Happens at $1 Million?
Large cross-chain orders deserve separate treatment.
For $1 million:
1 basis point = $100
5 basis points = $500
10 basis points = $1,000
50 basis points = $5,000
That means a route offering:
$3 lower gas
is irrelevant if it introduces:
8 bps additional execution loss
because the latter represents:
$800
at $1 million.
Large-order testing should therefore prioritize:
- executable capacity,
- delivered value,
- price impact,
- solver economics,
- completion certainty,
before obsessing over fixed gas.
The $1 Million Liquidity Trap
An important DN rule will be:
Never scale a $1,000 quote linearly to estimate a $1 million route.
Cross-chain liquidity is nonlinear.
At higher sizes:
- solver inventories can become constrained,
- LP utilization can change,
- different bridges may become optimal,
- DEX price impact can accelerate,
- maximum route limits may be reached,
- route splitting may appear,
- quote availability may disappear entirely.
Across, for example, exposes min/max route limits and notes that fees respond to pool utilization.
deBridge currently states that the consumer product has a maximum trade amount of about $5.5 million, again demonstrating that route capacity is a real variable rather than an abstract assumption.
DN Executable Capacity
The eventual Index should therefore include:
Maximum Executable Quote
Largest size at which a route returns an economically valid executable quote.
Large-Order Cost Slope
Change in cost bps as size increases.
Route Mutation Rate
How frequently the underlying bridge or liquidity path changes as size grows.
Large-Order Completion Rate
Observed success at professional and institutional sizes.
These measurements can reveal a platform that looks ordinary at $1,000 but becomes highly competitive at $500,000.
Or the reverse.
Latency Has a Price
Consider two routes.
Route A
Cost:
8 bps
Settlement:
5 seconds
Route B
Cost:
5 bps
Settlement:
20 minutes
Which is better?
For someone moving stablecoins into long-term storage:
probably Route B.
For an arbitrageur trying to capture a rapidly closing price discrepancy:
possibly Route A.
Therefore latency cannot be assigned one universal dollar value.
The DN calculator lets the reader specify an:
opportunity cost in basis points per hour
and converts the route delay into an economic cost.
DN Latency-Adjusted Cost
Suppose:
Capital:
$100,000
Delay:
30 minutes
Opportunity cost:
4 bps per hour
Latency cost:
$100,000 × 4/10,000 × 0.5
= $20
A supposedly cheaper route may therefore become economically inferior for time-sensitive capital.
For passive transfers, readers can simply set opportunity cost to zero.
Quote Freshness Matters Here Too
The previous DN DEX Quote Decay Index introduced the principle that quoted execution quality changes through time.
Cross-chain routes amplify this issue because they can combine:
- source DEX quote
- bridge quote
- destination DEX quote
- gas estimates
- solver pricing
deBridge’s current documentation specifically recommends refreshing quotes around the 30-second mark where signing delays can make operating expense assumptions stale.
LI.FI similarly notes that executable route availability depends on current liquidity, amount, bridge availability and price impact.
So DN-CEQI will record:
Quote-to-Submission Latency
and
Quote-to-Delivery Deviation
rather than pretending the first number presented to a user is automatically the final economic outcome.
The DN Cross-Chain Route Test
Every benchmark run should use identical controls wherever technically possible.
Route Parameters
Same:
- origin chain
- destination chain
- input token
- output token
- USD size
- wallet architecture
- slippage tolerance
- gas policy
- sampling window
Timing
Capture:
T0: quote request
T1: quote returned
T2: transaction submitted
T3: origin confirmation
T4: destination transaction
T5: intended output economically usable
Pricing
Record reference-market prices at:
T0
and
T5
so ordinary asset-price movement is not automatically attributed to the bridge.
Test Across Different Market Conditions
One quiet Tuesday afternoon is not enough.
Eventually DN should divide observations into:
Normal Liquidity
Routine conditions.
High Volatility
Sharp market movement.
Congested Networks
Gas or block-space stress.
Weekend Liquidity
Lower institutional activity in some markets.
Long-Tail Assets
Thin liquidity.
Stablecoins
Minimal asset-volatility noise.
This lets readers see not merely:
Which route is cheapest?
but:
Which route remains economical when conditions deteriorate?
DN Cross-Chain Execution Dataset
The long-term data object should expose fields such as:
observation_id
timestamp_utc
origin_chain
destination_chain
input_asset
output_asset
input_value_usd
provider
underlying_bridge
route_type
quoted_output
minimum_output
actual_output
source_gas_usd
destination_gas_usd
protocol_fee_usd
solver_fee_usd
app_fee_usd
origin_slippage_bps
destination_slippage_bps
quote_decay_bps
quote_latency_ms
usable_funds_latency_sec
completion_status
recovery_required
recovery_cost_usd
recovery_latency_sec
all_in_cost_usd
all_in_cost_bps
methodology_version
evidence_class
Once populated with actual measurements, this becomes a much more valuable web resource than another subjective list of “top bridges.”
DN Evidence Classification
All published observations should use the same evidence standard introduced across the new DN research programme.
OBSERVED
Measured directly by Decentralised News.
CALCULATED
Mathematically derived from an observed input.
MODELLED
Generated from explicitly disclosed assumptions.
PLATFORM-REPORTED
Claimed by a protocol or provider.
THIRD-PARTY SOURCED
Taken from an identified independent source.
For example:
Across typical ~2 second fill time
is currently:
PLATFORM-REPORTED
until DN runs an independent sample large enough to classify the observed distribution.
The Future DN Leaderboard
Once the empirical sample is sufficiently large, the index should ultimately look like this:
| Route | $1K Cost | $10K Cost | $100K Cost | $1M Cost | Median Latency | P95 Latency | Completion Rate | Recovery Burden |
|---|---|---|---|---|---|---|---|---|
| Route A | Live data | Live data | Live data | Live data | Live data | Live data | Live data | Live data |
| Route B | Live data | Live data | Live data | Live data | Live data | Live data | Live data | Live data |
| Route C | Live data | Live data | Live data | Live data | Live data | Live data | Live data | Live data |
DN will not use invented numbers to fill an aesthetically pleasing table.
The missing data is itself the beginning of the research programme.
Which Cross-Chain Route Is Cheapest?
There is no universal winner.
The economically best route can depend on:
- transfer size,
- origin chain,
- destination chain,
- asset pair,
- network congestion,
- available solver inventory,
- DEX liquidity,
- desired settlement speed,
- recovery tolerance,
- whether the user needs the same asset or another asset.
For a $1,000 stablecoin transfer, fixed fees can determine the outcome.
For a $1 million volatile-asset transfer, a few basis points of liquidity deterioration can dwarf almost every fixed fee in the transaction.
The correct answer therefore requires a route-level calculation.
That is what the tool below is designed to provide.
DN Cross-Chain Route Cost Calculator
The calculator measures:
- source gas
- fixed bridge cost
- bridge / solver fee
- origin slippage
- destination slippage
- destination gas
- app / integrator fees
- quote decay
- latency
- expected failure recovery cost
It then calculates:
Direct Cost
Actual execution friction before time and failure adjustment.
Direct Cost in Basis Points
Makes routes comparable across transaction sizes.
Latency Cost
User-defined opportunity cost of waiting.
Expected Recovery Cost
Probability-weighted recovery burden.
Failure-Adjusted All-In Cost
The most complete DN route-cost estimate.
Standard Size Sensitivity
The same assumptions are automatically modelled at:
$1K
$10K
$100K
$1M
Cross-Chain Route Cost Calculator
Calculate the failure-adjusted economic cost of a cross-chain route. Include only costs that are not already embedded in another field to avoid double counting.
Transfer
Time & Recovery
DN Route Analysis
Cost Sensitivity by Transfer Size
| Transfer | Direct Cost | Latency | Expected Recovery | All-In Cost | All-In bps |
|---|
DN-CEQI v1.0 Formula
Variable costs include bridge/solver fees, application fees, origin slippage, destination slippage and quote deterioration.
Do not enter the same fee twice. For example, if destination gas is already embedded in the bridge/solver quote, leave the separate destination gas field at zero.
Compare Cross-Chain Routes
Partner links are provided for readers who want to compare current executable routes. Commercial relationships do not affect DN research methodology.
How to Read the Calculator
The default inputs are illustrative only.
They are not measured deBridge, Across, Stargate, Relay, LI.FI or OKX costs.
That distinction should remain visible.
A reader should replace the assumptions using the actual route they are considering.
For example, if the route quote already embeds the solver’s destination gas:
Destination Gas = $0
Do not add it again.
If the route has no origin swap:
Origin Slippage = 0
If no application fee exists:
App Fee = 0 bps
This makes the tool useful across multiple architectures without pretending they charge fees identically.
Frequently Asked Questions
What is the cheapest way to bridge crypto between chains?
There is no universally cheapest bridge. The result depends on the source and destination networks, asset, trade size, liquidity, gas, route architecture and timing. Comparing the final usable destination value is more reliable than comparing advertised bridge fees alone.
How much does it cost to bridge $1,000 of crypto?
The answer is highly route-dependent. Fixed gas is disproportionately important at $1,000. A $5 cost alone represents 50 basis points, or 0.5%.
How much does it cost to bridge $100,000?
At $100,000, fixed gas becomes less important. One basis point equals $10, so liquidity, solver fees and slippage increasingly determine total cost.
What about a $1 million cross-chain transfer?
At $1 million, one basis point equals $100. Large transfers should be evaluated for executable capacity, price impact, solver liquidity and route limits rather than extrapolating from small-transfer quotes.
Is bridge fee the same as total cross-chain cost?
No. Total cost can include source gas, bridge or solver fees, DEX price impact, origin and destination slippage, destination gas, application fees, quote deterioration, latency and failure recovery.
What is destination gas?
Some routes require gas on the destination chain for a swap or contract call. Other architectures embed that cost in the route or provide gas automatically. It should only be counted separately when it is genuinely an additional user cost.
What happens if a cross-chain swap fails after bridging?
It depends on the route architecture. Some systems refund automatically. Some return an intermediate asset. Others can require manual recovery or another transaction. This is why DN measures recovery burden separately from headline fees.
Are cross-chain swaps atomic?
Not necessarily. LI.FI specifically documents that a completed bridge leg cannot always be reversed when a subsequent destination operation fails. The user may instead receive an intermediate asset.
Is the fastest bridge always best?
No. The optimal balance between cost and speed depends on what the user is doing with the capital. Stargate, for example, explicitly offers execution modes that trade speed against gas efficiency.
Are bridge aggregators better than individual bridges?
Not inherently. Aggregators can compare multiple routes, but they may also introduce their own application economics. DN measures both route quality and the final aggregator-inclusive outcome.
What is the DN Failure-Adjusted All-In Cost?
It is the estimated direct route cost plus the economic cost of latency and the probability-weighted expected burden of recovering from a failed or partial transaction.
What the First Live DN Cross-Chain Test Should Measure
The strongest first empirical dataset would not attempt to test every imaginable route.
I would start with a deliberately controlled benchmark:
Routes
Arbitrum → Base
Base → Arbitrum
Ethereum → Base
Base → Ethereum
Ethereum → Solana
Solana → Ethereum
Assets
USDC → USDC
then:
ETH → USDC
then:
ETH → SOL
Sizes
$1,000
$10,000
$100,000
$1,000,000 where executable
Platforms
deBridge
Across
Stargate where eligible
Relay
LI.FI / Jumper
OKX DEX Bridge
The same route should be requested from every qualifying provider within the shortest practical synchronized sampling window.
That gives DN something almost no conventional crypto publication offers:
a controlled cross-chain execution experiment rather than a list of marketing claims.
The Real Competitive Moat
When the empirical layer goes live, each index observation can produce multiple reusable DN research assets:
DN Cross-Chain Execution Dataset
Raw observations.
DN Route Cost Calculator
Reader-facing modelling.
DN Route Size Curve
$1K → $10K → $100K → $1M.
DN Latency Distribution
Median → P75 → P95.
DN Recovery Dataset
Completed → delayed → partial → refunded → manually recovered.
DN Bridge Cost History
How route economics change through time.
DN Cross-Chain Route API / JSON
Machine-readable data for AI engines, researchers and other publications.
This turns a single article into a continuously growing research object.
Final Verdict
Cross-chain execution is too complex to be reduced to a bridge’s advertised fee.
The economically relevant question is:
How much usable value arrives, how long does it take, and what does the user face when execution goes wrong?
For smaller transfers, fixed gas and messaging costs can dominate.
For larger transfers, percentage fees, liquidity, slippage and solver pricing become increasingly important.
For time-sensitive capital, latency itself has a price.
And for any route, the rare transaction that requires hours of recovery can matter more than tiny differences in average headline fees.
The DN Cross-Chain Execution Quality Index therefore evaluates cross-chain infrastructure as an execution system rather than merely a transportation layer.
Its central measurements are:
DN All-In Cross-Chain Cost
DN Failure-Adjusted Cost
Time to Usable Destination Balance
Cross-Chain Cost Elasticity
Executable Capacity
Quote-to-Delivery Deviation
Recovery Burden
Once the empirical dataset is sufficiently populated, these metrics can answer a much more useful question than “Which bridge is cheapest?”
They can tell us:
Which cross-chain route actually preserves the greatest amount of a user’s capital under real execution conditions?
Methodology: DN-CEQI v1.0
Last reviewed: 1 September 2026
18+ educational content only. Cross-chain transactions involve smart-contract, liquidity, execution, bridge, validator, oracle and blockchain risks. Fees and routes can change rapidly. Verify the destination network, token, address, transaction details and current platform availability before transferring assets.





