
Bitcoin’s Bear Market Is Over — Here’s the Data That Proves It (And the Risk Nobody Is Talking About)
The 5 Signals That Could Confirm Bitcoin’s New Bull Market.
The five converging signals that define this moment, the one hidden ceiling that could stop the rally cold, and where to position before the golden cross confirms.
May 2026 | Decentralised News | Markets & Macro
Bitcoin crossed $82,000 this week for the first time since January, and the internet is doing what it always does — half the market calling a new bull run, the other half certain it’s a bull trap. Both camps are partially right, and both are missing the most important data point in the entire setup.
This is not a standard cycle recap. This is a systematic breakdown of every material signal — on-chain, technical, macro, institutional, and derivative — currently active in the Bitcoin market, ranked by reliability, cross-referenced against historical precedent, and filtered for what actually moves price. Where the data supports the bull case, we say so. Where it exposes fragility the consensus is ignoring, we go there too.
By the end, you will know exactly which levels to watch, what confirmation looks like versus what a failed breakout looks like, and how to position across three distinct scenarios.
The Setup in Plain Numbers
Before anything else, anchor on the facts on the ground as of May 10, 2026.
Bitcoin is trading at approximately $80,700. Its all-time high was $126,198 on October 6, 2025 — seven months ago. That means the current price represents a 36% drawdown from ATH, not a recovery from a deep multi-year bear market. The low of this correction was approximately $60,000, struck in February 2026. The bounce from that low is roughly 35%. Bitcoin has not closed above its 200-day moving average since October 2025. The Fear and Greed Index sits at 38 — Fear.
Those are your coordinates. Now let’s go deeper.
Signal One: The Moving Average Structure — What Just Happened and What Comes Next
Three moving averages define Bitcoin’s medium-term trend: the 50-day, 100-day, and 200-day. Their relative positions are the market’s most broadly watched technical framework, and their current configuration is genuinely notable.
The 50-day crossed above the 100-day in the past week. This is Stage Two of the classic three-stage golden cross sequence. It indicates short-term momentum is now stronger than medium-term momentum — the fuel is gathering at the base. On its own, this is a supporting signal, not a trade trigger.
The critical level is the 200-day moving average, currently near $83,000. Bitcoin has not closed above this line since October 2025. Every time it has tried to reclaim this level in the current correction — in December 2025, February 2026, and late April 2026 — it has been rejected. This is the third or fourth attempt depending on how you count wicks, and it is where the entire setup lives or dies.
Here is what makes this attempt structurally different from the prior rejections: those prior attempts came with the short-term holder cost basis acting as an overhead weight, meaning recent buyers were underwater and selling every bounce. That has now changed — which brings us to Signal Two.
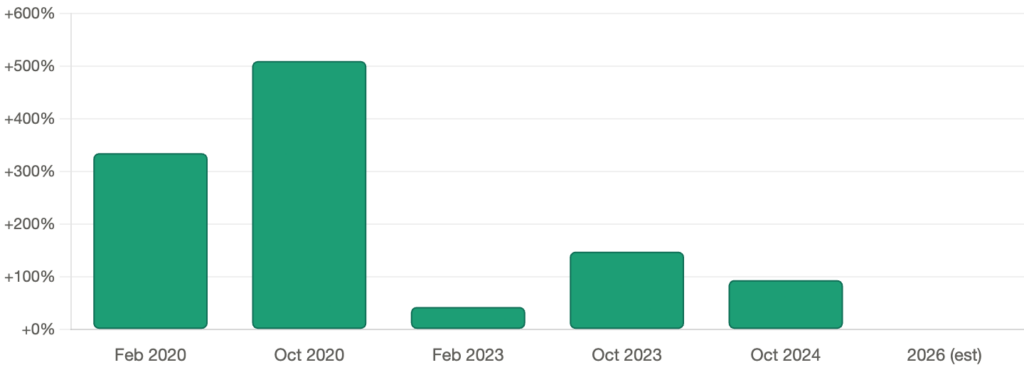
The golden cross — the 50-day crossing the 200-day — has not yet occurred. The 50-day sits roughly $8,000 to $10,000 below the 200-day in simple moving average terms, and given the current pace of price recovery, analysts estimate it is three to five weeks away if price holds. Historically, every Bitcoin golden cross has preceded or accompanied major bull market phases. The February 2023 golden cross was followed by a 43% gain. The October 2023 cross preceded a 148% surge. The October 2024 golden cross marked the launch from approximately $65,000 to Bitcoin’s eventual $126,000 peak — a 94% gain.
Lagging signal or not, institutional algorithmic systems are programmed to respond to it. When it occurs, it is not just a signal — it triggers a class of automated buying that is indifferent to narrative.
What to watch: A daily close and weekly candle close above $83,000 is the immediate confirmation. That converts the 200-DMA from seven-month resistance into support. Without that weekly close, the setup remains unconfirmed and the pattern of failed breakouts continues.
You can track Bitcoin’s live technical structure with a free account on TradingView — the most comprehensive charting platform in the industry, used by professionals and serious retail traders alike.
Signal Two: The On-Chain Level That Has Called Every Bitcoin Bottom
The short-term holder (STH) realized price is the single most reliable on-chain cycle indicator Bitcoin has. It represents the average acquisition cost of every coin held by an investor who bought within the last 155 days — the cohort of recent market entrants most sensitive to price.
Bitcoin reclaimed this level in early May 2026. It currently sits at approximately $79,000–$80,300, depending on the data source and the real-time movement of the metric itself.
Here is why this matters more than almost any other data point in this entire piece.
When Bitcoin trades above the STH realized price, the average recent buyer is profitable. Profitable holders don’t panic sell. They buy dips. They add to positions. The reflexive selling pressure that creates cascading dumps on every bounce — gone. Instead, every pullback becomes a buying opportunity rather than a get-out-before-it-gets-worse moment.
When Bitcoin trades below the STH realized price, the inverse applies with brutal consistency. Every rally is met with supply from holders trying to exit at break-even. That overhead supply cap kills momentum at every inflection point. This is mechanically why Bitcoin spends so much time going nowhere or declining once it breaks the STH level — not because of conspiracy or manipulation, but because supply dynamics become overwhelmingly negative.
The 2022 bear market officially ended — in retrospect — the day Bitcoin reclaimed the STH realized price in January 2023. Not the halving. Not the ETF approval. That single on-chain level. The price went on to gain approximately 440% over the following 21 months.
Research firm Glassnode confirmed this reclaim in their May 7, 2026 report, adding a critical detail the popular analysis is missing: “Should price sustain above these two levels in the coming week, the deep value regime that persisted from early February 2026 through now would rank among the shortest episodes of its kind in Bitcoin market history.”
That framing carries weight. The 2022 bear market’s deep value regime lasted approximately 13 months. This one lasted roughly three months. Either the bottom was extraordinarily well-defended by institutional structural buying, or the reversal is happening faster than any prior cycle — which would itself be a function of the ETF market changing the mechanics of Bitcoin’s accumulation phase.
The hidden risk here: The STH realized price is not a static number — it drifts upward as new coins are acquired at higher prices during the recovery. Bitcoin is currently hovering only $400–$1,700 above this dynamic support line. That is an uncomfortably thin margin. A return to $78,500 or lower on any macro shock or ETF flow reversal would break this level and reset the entire thesis. This is the most important stop-loss level in the current setup.
For those wanting to monitor on-chain data in real time, Glassnode and CryptoQuant provide the most rigorous institutional-grade on-chain analytics available.
Signal Three: The ETF Cost Basis — The Institutional Trigger That Hasn’t Fired Yet
Spot Bitcoin ETFs launched in January 2024. Since then, cumulative net inflows have reached approximately $60 billion. The average acquisition price across every dollar ever invested in spot Bitcoin ETFs sits at approximately $83,100–$83,200 — a figure that happens to sit almost exactly on top of the 200-day moving average.
Bitcoin is currently below both. That means the average ETF investor in the world — including institutions that allocated through BlackRock’s IBIT, Fidelity’s FBTC, and the dozen other issuers — is sitting on an unrealized loss.
The moment Bitcoin closes above $83,200 changes the psychology of this entire institutional cohort simultaneously. Allocators who paused new inflows while in the red restart conversations. Advisers who have been fielding client complaints about crypto exposure stop getting those calls. The largest and most patient demand cohort in Bitcoin’s history — one that has demonstrated they buy on dips even while underwater — flips from defense to offense.
The ETF flow data right now is already remarkable before that flip has occurred.
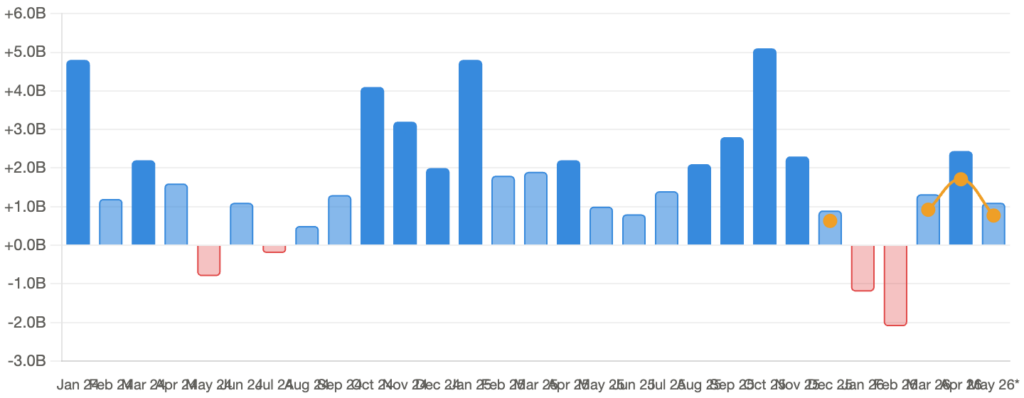
US spot Bitcoin ETFs recorded $2.44 billion in net inflows during April 2026 — the strongest monthly figure since October 2025, when Bitcoin hit its all-time high. In the first week of May, weekly inflows crossed $1 billion for the first time since January. BlackRock’s IBIT alone pulled in $721.5 million over three trading days and commands a 70% market share of total ETF flows, with $66.9 billion in assets under management.
Here is the detail that separates institutional conviction from momentum chasing: IBIT attracted $2.3 billion in April despite posting negative year-to-date returns. Bloomberg ETF analyst Eric Balchunas called this “uncommon behavior” for an ETF investor base — because it is. Retail money does not pile into losing funds. Institutional mandate-driven and discretionary forward allocation does. These buyers are not reacting to price — they are setting it.
Furthermore, ETFs are absorbing Bitcoin at a rate significantly exceeding daily mining output of approximately 450 BTC. Net issuance from miners produces roughly 450 Bitcoin per day into the market. On any day with meaningful ETF inflows, the market is absorbing multiples of that. The float available for price discovery is being systematically removed from liquid circulation.
The supply math is unambiguous: exchange balances have been falling toward multi-year lows. Whale wallets added approximately 270,000 BTC in a single month during the April–May accumulation phase. Long-term holders are not distributing. And now a $60 billion institutional pool sits one good weekly candle away from flipping into net unrealized profit.
Where to trade Bitcoin: The exchanges below offer the best combination of liquidity, leverage options, and fee structures for capturing this setup across different risk profiles.

- Bybit — Industry-leading perpetuals and spot trading, deep liquidity, up to $500 welcome bonus for new users
- BloFin — Best-in-class perpetuals with up to 150x leverage, preferred by professional derivatives traders
- OKX — One of the world’s largest exchanges with advanced order types, copy trading, and a seamless Web3 wallet
- MEXC — Zero maker fees, widest altcoin selection, and competitive perpetual contracts
- Binance — Global volume leader, most liquid order books, full suite of products from spot to options
Signal Four: The Macro Environment — The PMI Story Nobody Has Properly Explained
The relationship between the ISM Manufacturing PMI and Bitcoin’s price cycle is one of the most consistently misunderstood macro correlations in markets. Most people present it as a simple: PMI above 50 = Bitcoin goes up. The reality is considerably more nuanced — and considerably more bullish for the current setup than most analysts acknowledge.
The ISM Manufacturing PMI broke back above 50 in January 2026, after a contraction phase lasting approximately 26 months — one of the longest in modern US economic history. April 2026’s print came in at 52.7, with the New Orders sub-index at 54.1 — a strong signal of accelerating incoming demand. The 200-day moving average of the PMI has turned upward for the first time since mid-2022.
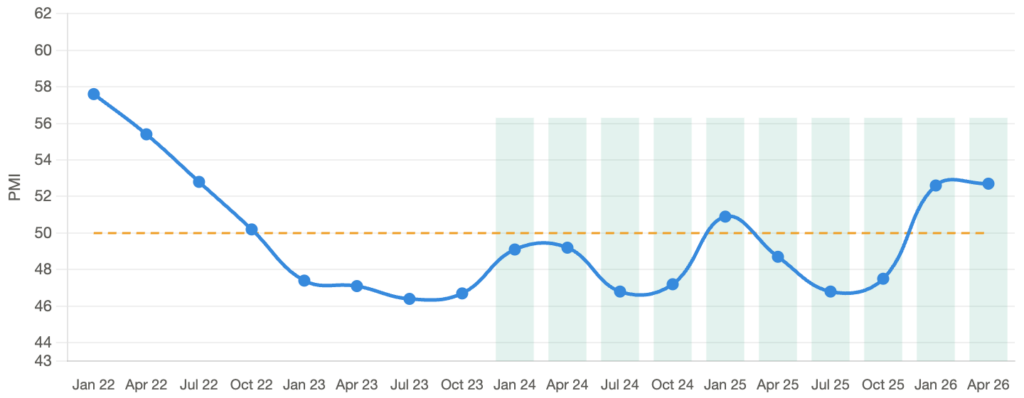
Bitcoin analyst Plan_C, who has tracked the PMI-Bitcoin relationship across all four major cycles since 2009, argues that the critical dynamic is not the PMI crossing 50 — it is the duration and depth of the sub-50 contraction. An unusually long contraction creates an unusually long accumulation window, during which smart money positions at low prices before the economic expansion phase funds the next major rally. The 26-month contraction from late 2022 to early 2026 was the longest in the dataset.
The counter-argument, presented by macro strategist Julien Bittel at Global Macro Investor, is that PMI is not a leading indicator for Bitcoin but a coincident one — meaning it registers what is already happening rather than predicting what comes next. Bittel argues that financial conditions — specifically the Fed’s liquidity posture and global dollar supply — are the upstream drivers, and PMI is downstream of that. This is a valid methodological critique, but it does not invalidate the bullish conclusion: financial conditions have been loosening in 2026, with the Fed’s effective rate expectations declining, global central banks adding liquidity, and dollar strength moderating.
The macro context matters for one additional reason that the technical analysis crowd consistently ignores: Bitcoin’s 2022–2023 bull market ran against the macro current. The Fed was hiking at the fastest pace in 40 years. Liquidity conditions were explicitly hostile. Bitcoin still ran. If the macro environment is now turning supportive rather than hostile — PMI expanding, Fed increasingly neutral, dollar weakening — then the tailwind is not just absent headwinds but active lift.
One critical caveat: The April 2026 ISM report also flagged an 11th consecutive decline in export orders and the first factory employment drop in nine months, with input cost inflation at a 10-month high. This is not a clean expansion — it is a mixed reading. The June 1 ISM release will be the next binary event to watch.
Signal Five: Derivatives Positioning — The Wall of Worry Is Real
Perpetual futures funding rates have been negative or near-zero throughout Bitcoin’s recovery from the February low. This means traders have been paying to maintain short positions throughout a 35% price rally. That is definitionally a wall of worry rally — the most durable type of price appreciation in financial markets, because every short that gets squeezed adds buying pressure to the move rather than competing with it.
As of this week, funding has flipped from negative to neutral, according to Bitfinex analysts. That is the correct progression — not from deeply negative to deeply positive (which would signal excessive leverage and a local top), but the measured normalization that accompanies a genuine trend change.
Additionally, options market structure reveals that dealers are short gamma around the $82,000 level. Dealers maintain delta-neutral positions, which means as price rises toward $82,000, they must buy to hedge their short gamma exposure — adding systematic buying pressure that is independent of any directional view. This is a mechanical force, not sentiment.
The 28-day stablecoin supply rate of change has also flipped positive — historically one of the most reliable leading indicators of incoming buy pressure in crypto. When stablecoin supply is growing, dry powder is accumulating on the sidelines. That capital is positioned to enter risk assets, and Bitcoin typically captures the first and largest wave of inflows when it does.
One warning counter-signal: Santiment data flagged that Bitcoin’s wallet count declined by 245,000 addresses in five days in early May — the fastest rate of holder reduction in nearly two years. This is consistent with retail profit-taking, not panic selling, but it reveals that retail participation is thinning out even as institutional inflows accelerate. A market carried exclusively by institutional flows and lacking retail momentum has a structural vulnerability: the moment ETF inflows slow or reverse, there is no retail bid deep enough to absorb the slack. This was demonstrated brutally in the post-ATH sell-off from October 2025 onward.
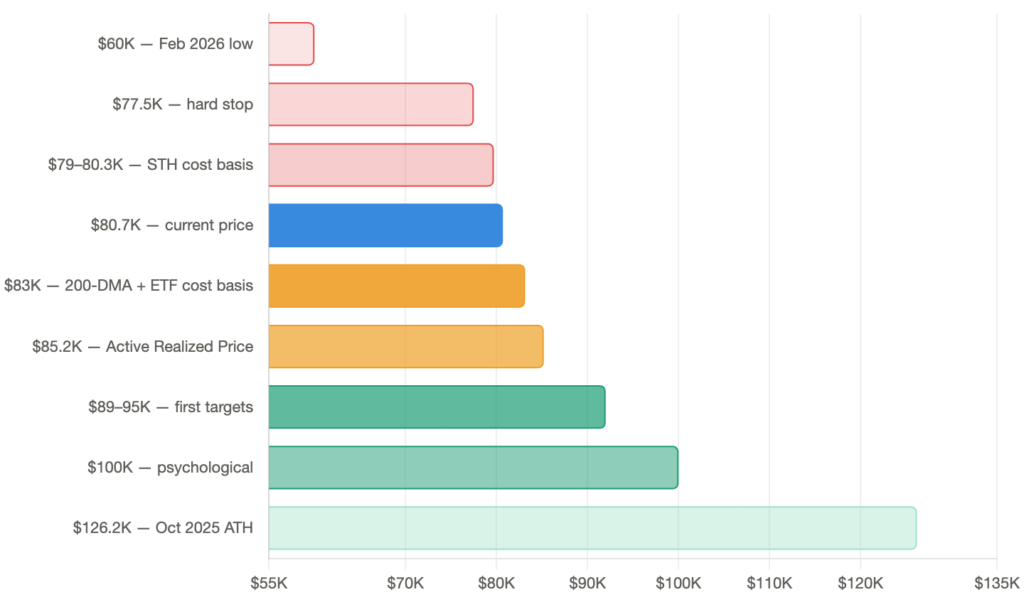
The Level Nobody Is Talking About: The $85,200 Active Realized Price
Every analysis of this setup centers on $83,000 as the critical level. The 200-DMA. The ETF cost basis. The bears’ last stand. All correct as far as they go — but there is a more important on-chain level that the popular analysis consistently omits.
The Active Realized Price sits at approximately $85,200.
This metric, tracked by Glassnode, represents the average cost basis of all Bitcoin supply that has moved on-chain in the last year — every coin held by an active market participant, excluding dormant long-term holders. It is the most comprehensive measure of what the market’s active participants actually paid, and when Bitcoin trades above it, the average active participant is profitable.
The significance of this level is difficult to overstate. The $83,000 cluster (200-DMA + ETF cost basis) would flip ETF investors and technical traders. The $85,200 Active Realized Price would flip essentially every active market participant simultaneously — creating the broadest possible shift from supply overhang to demand support.
In Glassnode’s own words from their May 7, 2026 report: “Attention now shifts to the next major resistance at the Active Realized Price near $85,200, which tracks the cost basis of all non-dormant supply and represents the next structural threshold the market must reckon with.”
This is not a popular commentary figure. It does not appear in most retail analysis. But it is the level at which the character of this market changes qualitatively — not just technically.
The practical framework for the current setup:
|
Level |
Significance |
What It Confirms |
|
$79,000–$80,300 |
STH realized price (dynamic) |
Critical support — if broken, thesis resets |
|
$83,000–$83,200 |
200-DMA + ETF cost basis cluster |
First bull confirmation — triggers institutional and algorithmic bid |
|
$85,200 |
Active Realized Price |
Full structural bull confirmation — overhead supply clears |
|
$89,000–$90,000 |
Previous structural resistance |
First target after $85.2K breaks |
|
$100,000 |
Psychological round number |
Second major target, likely Q3–Q4 if setup confirms |
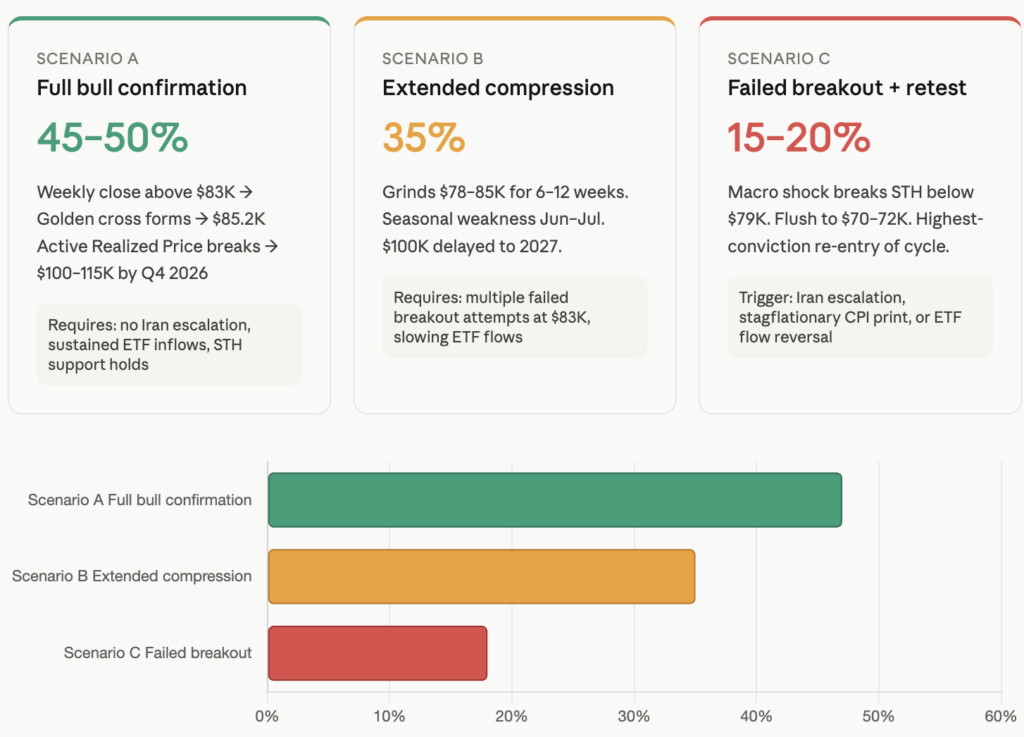
The Three Scenarios and Their Realistic Probabilities
Scenario A — Full Bull Confirmation (Probability: 45–50%)
Bitcoin closes above $83,000 on a weekly candle within the next two to three weeks. ETF inflows sustain or accelerate. PMI remains in expansion. The STH cost basis holds as support on any pullback. The golden cross forms in four to six weeks. The Active Realized Price at $85,200 gets tested and eventually broken. Bitcoin targets $89,000–$95,000 by Q3 2026 and makes a realistic run at $100,000–$115,000 by Q4 2026. This scenario requires no major macro shock and continued institutional mandate allocation.
Scenario B — Extended Compression (Probability: 35%)
Bitcoin grinds between $78,000 and $85,000 for six to twelve weeks. Failed breakout attempts above $83,000 are met with profit-taking. ETF inflows continue but at a pace insufficient to generate breakout momentum. Seasonally weak June–July period adds headwinds. The golden cross forms but produces only a minor and temporary pop. Bitcoin eventually resolves higher but does not reach $100,000 until 2027. This is the “death by boredom” scenario — not a collapse, but a grinding range that frustrates positioning on both sides.
Scenario C — Failed Breakout and Retest (Probability: 15–20%)
A macro shock — most plausibly a Strait of Hormuz escalation, a stagflationary CPI print forcing Fed hawkishness, or a sudden reversal in ETF flows — breaks the STH realized price below $79,000. Bitcoin flushes toward $70,000–$72,000, retesting the lower end of the historical support range. This would be the most painful outcome for current positioning but would also represent the highest-conviction long entry of this entire cycle if the broader structural thesis remains intact. The 2022 experience demonstrated that Bitcoin’s most explosive recoveries originate from exactly these “one more flush” conditions.
The Iran War Factor — The Risk the Market Has Not Priced Adequately
Every analysis of this Bitcoin setup treats the Iran war as a footnote or a parenthetical risk. This is a significant analytical mistake.
A Strait of Hormuz closure — even partial or temporary — would not be a standard geopolitical risk event for Bitcoin. It would be a systemic event that works through several channels simultaneously.
First, an oil shock. Roughly 20% of global seaborne oil passes through the Strait. Even a credible threat of disruption spikes Brent crude by 20–40% within days based on historical precedent. That feeds directly into CPI prints over the following four to six weeks.
Second, that CPI spike removes the Fed’s flexibility. The single most important variable for risk assets globally right now is the expectation of Fed neutrality or dovishness. An inflation spike from an oil shock locks the Fed out of any cutting posture and potentially forces jawboning of rate hikes. That is the single macro condition most likely to generate broad risk-off that sweeps up Bitcoin regardless of its internal on-chain setup.
Third, in the first leg of any macro shock, Bitcoin does not act as a safe haven. The 2022 Russia-Ukraine experience and the 2020 COVID crash both demonstrated that Bitcoin’s initial response to systemic risk is correlation with equities, not gold. It recovers and decouples over weeks and months — but the initial flush is indiscriminate. ETF investors — many of whom are advisers managing client portfolios — will reduce risk allocations under client pressure if broader markets sell sharply. That directly reverses the ETF inflow dynamic that is currently the structural pillar of this setup.
The war has not escalated materially as of May 10, 2026. But it has not resolved either. This is not a tail risk to acknowledge and dismiss — it is the primary binary event risk in the current setup.
The Morgan Stanley / Institutional Fee War — What It Actually Means
Morgan Stanley’s launch of spot Bitcoin trading on E*Trade at 50 basis points per trade — undercutting Coinbase, Robinhood, and Schwab — is real news and it matters. But not in the way most analysis presents it.
The significance is not that 8.6 million E*Trade clients are going to rush into Bitcoin because commissions dropped by 25 basis points. Retail traders do not make allocation decisions based on fee differences at this margin. The significance is structural and competitive.
What Morgan Stanley — a $1.5 trillion institution — is doing is fighting for distribution control of the Bitcoin market. The firm that wins the distribution race for American retail Bitcoin investors will not capture incremental fee revenue — it will capture the data, the relationship, and the platform lock-in that determines where the next generation of financial products gets sold. Bitcoin is the customer acquisition tool for the next decade of wealth management.
The fee compression happening in Bitcoin brokerage right now is the same dynamic that played out in ETF fees in the 2018–2023 period. Every basis point that falls from the commission structure expands the total addressable market by making Bitcoin viable as a smaller percentage of a diversified portfolio. A 2% fee makes a 2% Bitcoin allocation economically irrational. A 0.5% fee makes a 2% allocation plausible for an advisor managing $500,000 in assets under management. Multiply that across every registered investment adviser in America, and the addressable market expansion is enormous — it just plays out over three to five years, not three to five months.

The Correct Risk-Adjusted Trade Structure for This Setup
Given the confluence of signals, the genuine risks, and the levels defined above, here is how a serious trader should be thinking about positioning.
Core position: Bitcoin between $79,000 and $81,000, sized at whatever percentage of the portfolio represents comfortable exposure given a hard stop at $77,000–$77,500. Below $77,500, the STH realized price has been definitively broken, the thesis is invalidated, and the setup becomes Scenario C. No thesis survives its invalidating condition — exit cleanly and wait for the retest.
Add on confirmation: A weekly candle close above $83,000 is the first add trigger. Not a wick, not an intraday pump — a weekly close. This is the level that tells you the 200-DMA and ETF cost basis have been converted from resistance to support. Position sizing can increase meaningfully here because the risk profile has materially improved.
Second add on the Active Realized Price: A clean daily close above $85,200 with volume is the second add trigger. This is the structural confirmation that the overhead supply regime has fully cleared. Historically, price acceleration from this level is pronounced.
Targets: $89,000 initially, $95,000–$100,000 as primary objective, $110,000–$115,000 as cycle extension target for patient capital.
Leverage considerations: The wall of worry dynamic in funding rates makes moderate leverage (3x–5x) mathematically attractive in the near term. However, given the Iran war binary risk and the thin margin between current price and the STH stop-loss, aggressive leverage is inappropriate until Bitcoin puts meaningful distance above $83,000. One bad geopolitical headline at 10x leverage and you are liquidated before the thesis resolves.
For leveraged derivatives trading, BloFin offers the cleanest perpetuals interface for professional-grade position management. For spot accumulation with the deepest liquidity, Bybit and Binance remain the standard.

The Altcoin Question
This analysis has focused entirely on Bitcoin because Bitcoin is where the structural thesis lives. The altcoin market deserves a separate note.
The current environment — Bitcoin recovering but not yet confirming a bull structure above $85,200 — is historically the worst period for altcoin outperformance. Bitcoin dominance tends to rise during Bitcoin recoveries and fall only after Bitcoin has established a new high-confidence bull structure. Chasing altcoins before Bitcoin clears $85,200 is a category error — most altcoins have weaker holder bases, thinner ETF exposure, and higher beta to the downside in any Scenario C outcome.
Ethereum, with a market cap of approximately $233 billion and its own maturing ETF market, is the only altcoin that has an analogous structural institutional buyer narrative. Solana’s developer activity and memecoin cultural capital give it the strongest retail momentum story after Bitcoin and ETH. Everything else is speculation on timing the altcoin rotation correctly — a game that historically destroys more capital than it generates for all but the most precise operators.
The OKX Web3 wallet provides the cleanest single interface for managing cross-chain DeFi exposure when altcoin season does arrive, with native support for 70+ networks.
What to Watch in the Next 30 Days
These are the binary events and levels that will resolve the current ambiguity.
Week of May 12–16: Does Bitcoin attempt and hold a close above $83,000? Watch weekly candle closes, not intraday price action.
June 1: ISM Manufacturing PMI release. A reading below 50 would be a material macro headwind. A reading above 52 would reinforce the bull thesis.
May–June ETF flow data: Any week with net outflows above $500 million is a warning signal that institutional demand is flagging. Weekly inflows above $1 billion are confirmatory.

The STH realized price: Track this in real time on Glassnode or CryptoQuant. If it drifts to $81,000 or above while price stagnates, the distance between current price and this dynamic support shrinks further.
Iran ceasefire developments: Any credible de-escalation removes the primary macro tail risk and is likely bullish for Bitcoin within 24–48 hours of confirmation.
Golden cross timing: The 50-day crossing the 200-day, estimated three to five weeks out at current pace. When it forms, watch the next three to five weekly candles — sustained closes above the 200-DMA post-golden-cross is the highest-conviction confirmation in Bitcoin’s entire technical toolkit.
The Bottom Line
Bitcoin’s bear market correction from the October 2025 ATH is, on the weight of evidence, over or very close to over. The on-chain structure has shifted. Institutional demand is structural rather than speculative. The macro environment has turned from hostile to neutral. Derivatives positioning remains cleanly unconcentrated in the bullish direction — meaning there is no long squeeze waiting to happen.
The path to a new all-time high above $126,000 requires executing in sequence: close above $83,000, hold $83,000 as support, break $85,200, and sustain above it. Each step is a higher-probability event than the step after it, and each failed step resets the timeline without necessarily invalidating the eventual outcome.
The Iran war risk is real, not rhetorical. The retail holder decline is a genuine fragility point. The STH cost basis margin is thin. None of this means you do not have a position. It means you structure the position to survive a worst-case and profit from the expected case.
The bears had their best opportunity between February and April 2026. They did not take Bitcoin below $60,000. They did not generate a cascade of long-term holder capitulation. They did not break the institutional bid. The longer Bitcoin holds above $79,000, the more the probability weight shifts toward Scenario A.
Position accordingly — but position with a plan for every outcome, not just the one you want.
Where to Trade Bitcoin in 2026
|
Exchange |
Best For |
Key Features |
|
Spot + Perpetuals |
Up to $500 bonus, 0% maker fee promotions, 24/7 support |
|
|
Professional Derivatives |
Up to 150x leverage, zero maker fees on perpetuals |
|
|
All-in-one + Web3 |
Copy trading, integrated DeFi wallet, 70+ chain support |
|
|
Deepest Liquidity |
Largest global volume, most product suite, lowest spreads |
|
|
Altcoin Access + Fees |
Zero maker fees, widest token selection, competitive perps |
Decentralised News covers crypto, AI, and macro finance for readers who want signal, not noise. None of the above constitutes financial advice. All trading involves risk. Never trade more than you can afford to lose.

FAQ
Q: Is Bitcoin in a bull market in 2026? A: Bitcoin’s bear market correction from the October 2025 ATH of $126,198 shows multiple signs of ending as of May 2026. The short-term holder cost basis has been reclaimed, the 50-day moving average has crossed above the 100-day, and institutional ETF inflows have reached their strongest pace since October 2025. However, Bitcoin has not yet closed above the critical 200-day moving average at approximately $83,000, which is the technical confirmation threshold analysts are watching. A weekly close above $83,000 would mark the first confirmed bull signal since the correction began.
Q: What is the Bitcoin short-term holder cost basis and why does it matter? A: The short-term holder (STH) cost basis is the average acquisition price of all Bitcoin held by investors who bought within the last 155 days. When price trades above this level, recent buyers are profitable and tend to hold or buy more. When price trades below it, recent buyers are underwater and sell on every rally, creating a supply cap. Bitcoin reclaimed its STH cost basis (~$79,000–$80,300) in early May 2026, which historically has marked the transition from bear to bull market conditions.
Q: What is the Bitcoin ETF cost basis in 2026? A: The ETF cost basis represents the average acquisition price of all Bitcoin purchased through spot Bitcoin ETFs since their US launch in January 2024. In May 2026, this level sits at approximately $83,100–$83,200 — nearly identical to the 200-day moving average. Bitcoin trading above this level would put the average ETF investor back in profit, historically triggering a significant acceleration in institutional buying activity.
Q: What is the Active Realized Price for Bitcoin? A: The Active Realized Price, tracked by Glassnode, represents the average cost basis of all Bitcoin supply that has moved on-chain in the last year. In May 2026, it sits near $85,200. This is the level that, when broken to the upside, clears the majority of remaining overhead supply and has historically preceded the most sustained phases of Bitcoin price appreciation within bull cycles.
Q: What is the Bitcoin golden cross and when will it happen? A: The golden cross is when Bitcoin’s 50-day moving average crosses above its 200-day moving average — one of the most bullish technical signals in its history. Prior golden crosses preceded gains of 43% (February 2023), 148% (October 2023), and 94% (October 2024). As of May 2026, the 50-day has crossed above the 100-day, and the golden cross with the 200-day is estimated three to five weeks away if current price levels hold.
Q: What is the biggest risk to Bitcoin’s 2026 bull market? A: The primary tail risk is geopolitical escalation around the Iran war and a potential Strait of Hormuz disruption. An oil shock would spike inflation, remove the Fed’s flexibility, and trigger a broad risk-off event that would initially pull Bitcoin lower regardless of its on-chain structure. A secondary risk is ETF flow reversal — the current setup is disproportionately dependent on sustained institutional inflows, and any significant net outflow week would represent a material deterioration of the structural thesis.

Start Here — Build Your Crypto Infrastructure Safely
You don’t need to use everything at once.
Professionals reduce risk by having access to multiple rails so they are never dependent on a single platform.
Below is a simple, practical setup used by many experienced traders and investors.
1) Your Fiat Gateway (Primary Access)
Best starting point for deposits & withdrawals
Binance — reliable onboarding, deep liquidity, global coverage
👉 sign up
Why open this:
- Move from bank → crypto easily
- Convert large amounts efficiently
- Emergency exit capability
2) Your Trading Execution Venue (Fast & Flexible)
Best for active trading and broad market access
MEXC — huge altcoin selection & low trading friction
👉 sign up
Why open this:
- Trade markets not listed elsewhere
- Better execution during volatility
- Lower dependence on a single exchange
3) Your Advanced Tools & Derivatives Platform
Best for leverage, hedging and professional execution
Bybit — strong order controls & derivatives infrastructure
👉 sign up
Why open this:
- Proper stop loss tools
- Hedging capability
- Strategy flexibility
4) Your Yield & Passive Income Layer
Best for structured products and capital efficiency
Gate.com — structured yield & automated earning tools
👉 sign up
Why open this:
- Earn on idle capital
- Diversify platform risk
- Access structured strategies

5) Your Altcoin & Ecosystem Expansion Layer
Best for early market access and wide listings
KuCoin — broad token ecosystem
👉 sign up
Why open this:
- Access emerging markets
- Portfolio diversification
- Redundancy if one platform restricts access
Why This Structure Matters
Using one exchange creates a single point of failure.
Using multiple rails creates:
- Liquidity redundancy
- Faster reaction ability
- Lower operational risk
- Greater opportunity access
You don’t need large capital to start — you just need prepared infrastructure.
Practical Next Step
Open accounts gradually and verify them before you need them.
Most people only prepare during stress —
professionals prepare before it.
(Decentralised News provides infrastructure education, not financial advice. Always use proper security practices.)
Recommended reading:
Crypto Friction Cost Index 2026: What Active Crypto Traders Actually Pay in Hidden Costs Every Year
The Pandemic Market Playbook: How Outbreaks Move Stocks, Real Estate and Crypto
How to Use Bitcoin as Collateral for a Loan in 2026: The Complete Guide to Crypto-Backed Lending
Crypto for Retirement: The Complete 2026 Guide to Building a Self-Directed Crypto Pension
Bitcoin vs Gold vs Real Estate vs S&P 500: 10-Year Return Comparison
How to buy Bitcoin in 2026: the complete beginner’s guide by country
Lowest Crypto Futures Fees in 2026: Every Major Exchange Ranked and Calculated
Best Crypto Sign-Up Bonuses and New User Rewards in 2026
Best Crypto Futures Trading Competitions in 2026: Where Active Traders Can Earn Rewards


