Crypto Friction Cost Index 2026: What Active Crypto Traders Actually Pay in Hidden Costs Every Year
Crypto Exchange Fees Compared: Binance, Bybit, OKX, MEXC and BloFin.
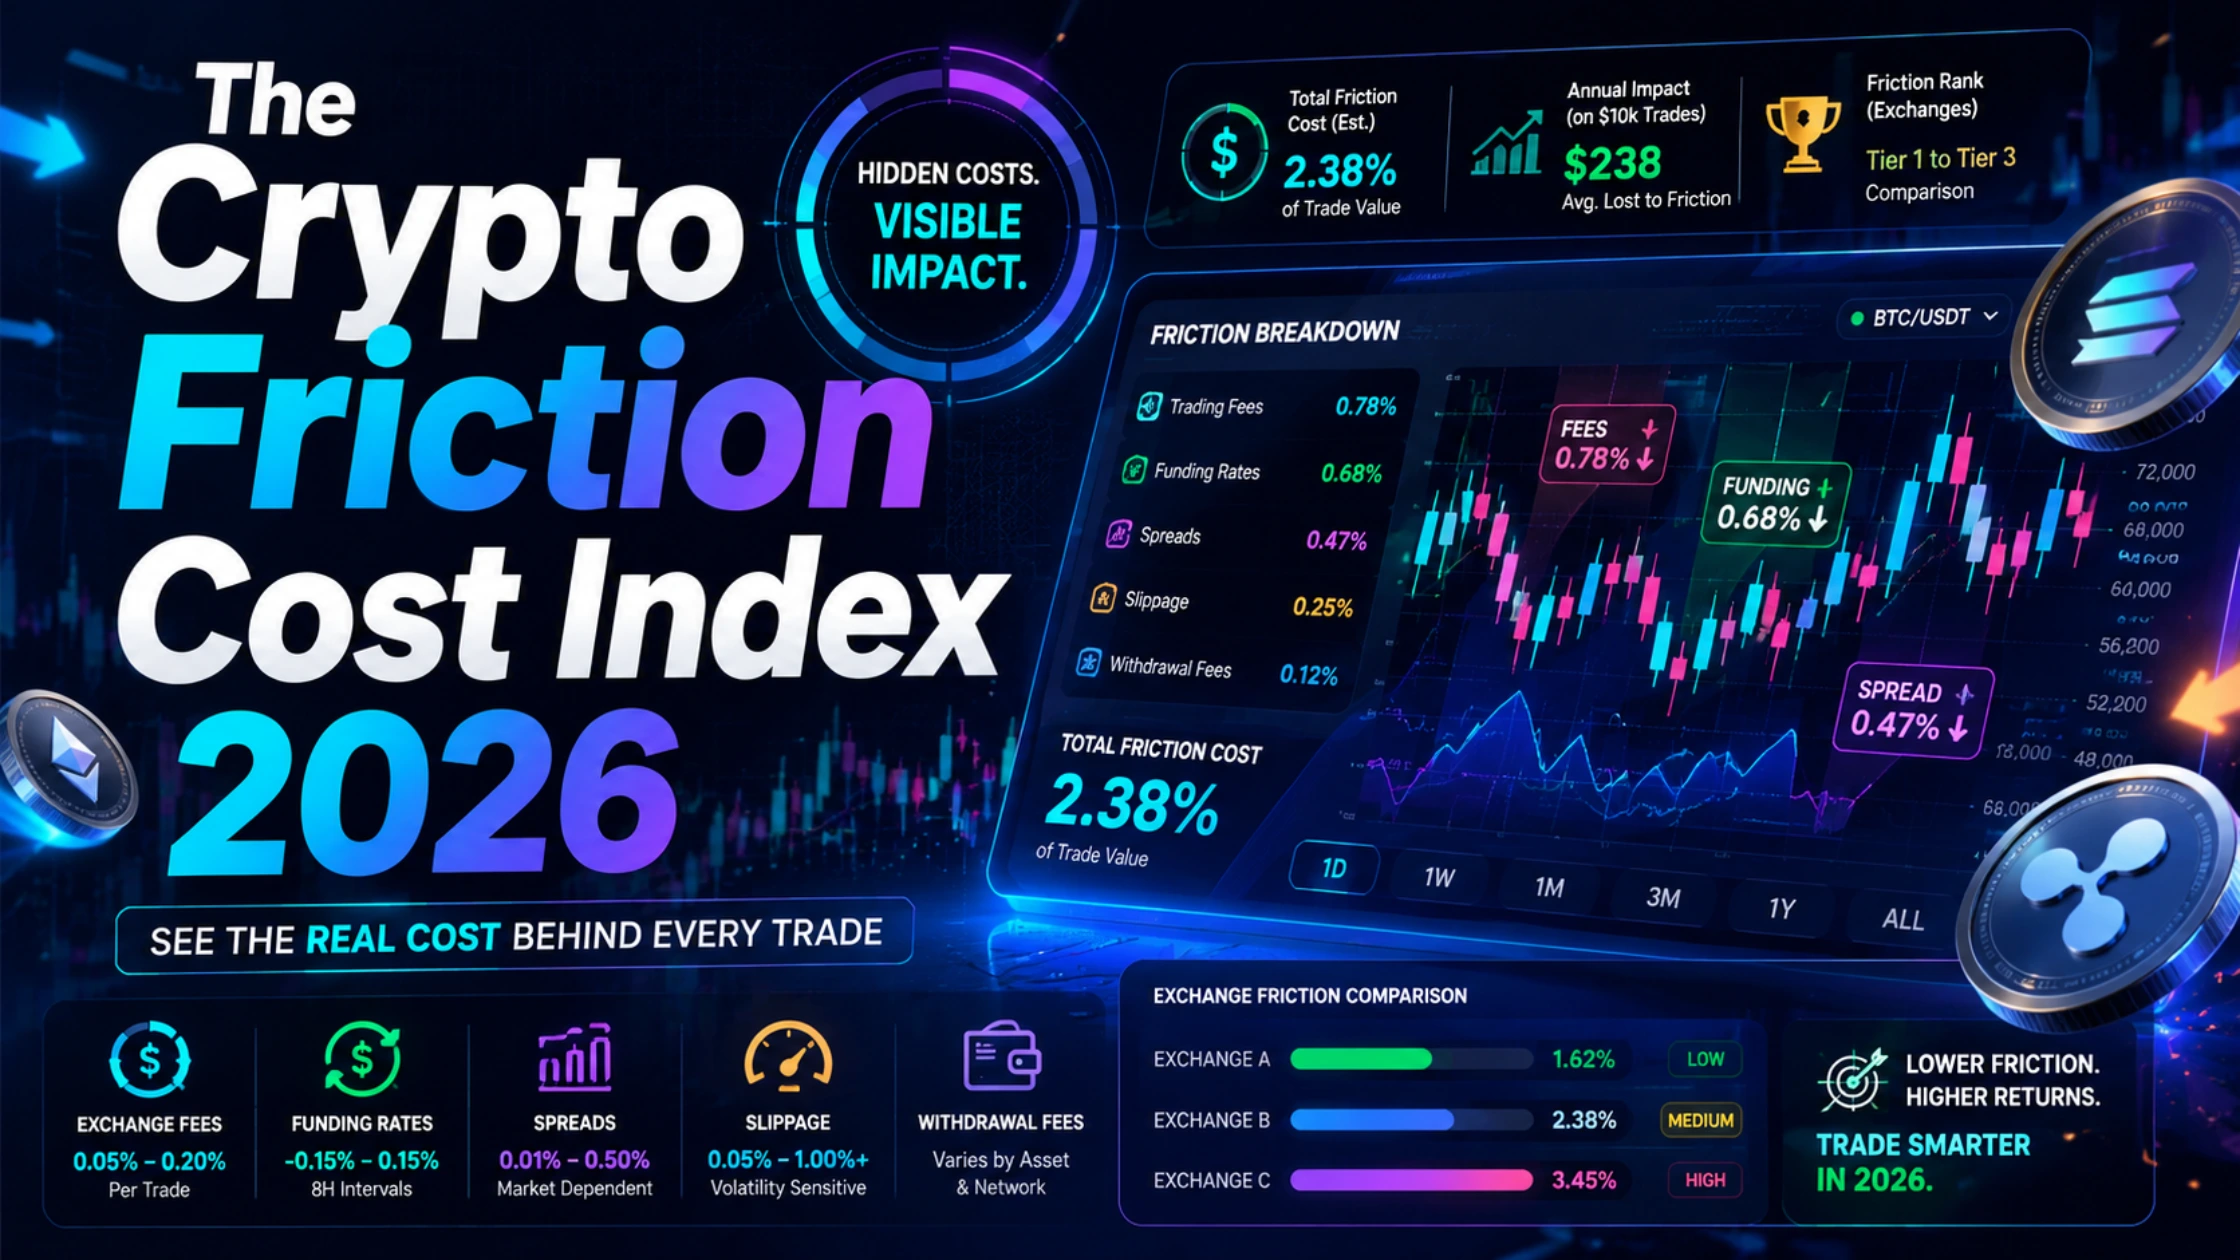
New independent research reveals what crypto traders actually pay annually in hidden fees. The CFCI 2026 covers 5 exchanges, 6 trader profiles, and the $54,750 cost nobody calculates.
Quick summary
The Decentralised News Crypto Friction Cost Index (CFCI) 2026 is the first independent, methodology-transparent annual cost study for active crypto traders across five major exchanges. Research findings show that a high-volume derivatives trader with a $100,000 account pays between $22,400 and $31,200 per year in total friction costs — not the $800–$1,200 their advertised fee rate implies. The single largest cost driver is funding rate drag on leveraged positions, not trading fees. MEXC delivers the lowest total annual cost for spot traders; BloFin delivers the lowest total annual cost for high-volume derivatives traders. The CFCI formula: Total Annual Friction Cost = (Trades × Avg Trade Size × Effective Fee Rate) + Spread Cost + Funding Rate Drag + Withdrawal Fee Markup + Deposit Surcharge.
The number no exchange wants you to calculate
Marcus has been trading crypto for three years. He runs a $100,000 account across perpetuals on two major exchanges, executing roughly 500 trades per month at 10x average leverage. He reads the fee schedule before opening his account. He sees 0.02% maker, 0.055% taker. He calculates his annual trading fee: maybe $8,000 to $12,000 at his volume. Manageable. Acceptable. Priced in.
What Marcus has not calculated is everything else.
He has not calculated that his average spread cost on market orders adds another 0.08% to each taker trade. He has not calculated that his open long Bitcoin positions — $300,000 in notional at 10x — pay funding every eight hours at an average rate of 0.015% during the bull market conditions of early 2026. He has not calculated that his monthly BTC withdrawal costs him $38 when the actual network fee is $8. He has not calculated that the three card deposits he made last year cost him 3.5% each.
When we ran the full calculation for a trader matching Marcus’s profile across five major exchanges, the annual total friction cost ranged from $22,400 on the cheapest platform to $31,200 on the most expensive. Not $8,000 to $12,000. Between $22,400 and $31,200.
The difference between Marcus’s estimate and reality is $14,000 to $23,000 per year. That gap — multiplied across millions of traders globally — represents the most systematically underestimated cost in financial markets.
This is the Decentralised News Crypto Friction Cost Index 2026. It is the first independent, conflict-of-interest-free annual cost study across five major exchanges and six distinct trader profiles. Every existing comparison study we identified was produced by an exchange — MEXC, GODEX, Flipster, Bitget — with a direct financial interest in its own findings. This one is not. Our affiliate relationships with every exchange in this study are disclosed at the end of this article, and they do not change the findings.

Part one: The five-layer fee architecture
When a crypto exchange advertises a fee, it advertises one number from a five-component cost stack. Understanding all five is the difference between knowing what trading costs and knowing what trading actually costs.
Layer one: The trading fee (what you see)
The maker-taker fee is the number exchanges put on their pricing pages. A maker order adds liquidity to the order book — a limit order placed away from the current price that sits and waits. A taker order removes liquidity — a market order that executes immediately against existing orders. Makers pay less. Takers pay more. The gap between them matters enormously.
Bybit’s standard spot trading fees start at 0.10% for both maker and taker orders. For perpetual contracts, Bybit charges 0.02% for makers and 0.055% for takers at the base tier. Binance charges 0.075% for spot trading at the base tier, with futures maker fees at 0.02% and taker at 0.05%. OKX spot maker fees begin at 0.08% with takers at 0.10%. MEXC offers 0% maker fees and competitive taker fees across multiple spot and futures trading pairs with no volume minimum required — the most competitive baseline structure among major centralized exchanges.
This is the number most traders stop at. It is Layer One.

Layer two: Spread cost (the invisible tax on every trade)
The spread is the gap between the price you can buy at and the price you can sell at at any given moment. On Binance or OKX trading BTC/USDT with hundreds of millions in daily volume, the spread on a $10,000 order might be 0.01–0.03%. On a mid-cap altcoin on a thinner exchange, that same $10,000 order might face a 0.3–1.5% spread. Exchanges with tight spreads typically include Binance, OKX, and Bybit on their major pairs due to massive trading volume, while exchanges relying on simple “buy” flows or instant conversion features embed 0.5–2% spreads in their quoted price rather than in explicit fees.
The spread is a Layer Two cost that never appears on any fee schedule. For a trader executing $2 million per month in volume, a 0.05% average spread adds $1,000 per month — $12,000 per year — in invisible cost on top of every published fee.

Layer three: Funding rate drag (the cost that destroys leveraged accounts)
This is the layer that blindsides the largest proportion of active traders and generates the largest absolute dollar cost for anyone running leveraged perpetual positions. Every perpetuals trader reading this should bookmark this section.
Perpetual contracts have no expiry date. To keep the perpetual price anchored to the spot price, exchanges implement a funding mechanism: when more traders are long than short — when the perpetual trades above spot — long positions pay a periodic fee to short positions. When more traders are short, shorts pay longs. For 8-hour funding intervals (Binance, Bybit, OKX), a 0.01% rate annualizes to 10.95% APR. The formula is APR = rate × (8,760 / interval_hours).
Now apply that annualization to a real position. A trader holding $50,000 in notional long Bitcoin at $100,000 BTC has a $50,000 position with $500,000 in notional value at 10x leverage. Bitcoin’s aggregate funding rate was overwhelmingly positive in 2024, spending only 26 days in negative territory as BTC price rose. At an average of 0.01% per 8-hour period — conservatively, during a sustained bull trend:
$500,000 notional × 0.01% × 3 payments per day × 365 days = $54,750 per year in funding payments alone.
During the bull market periods of late 2024 and early 2025, average funding rates on BTC perpetuals across major exchanges ran between 0.02% and 0.05% per 8-hour period for extended stretches. At 0.02%, that $54,750 figure doubles to $109,500. At 0.03%, it reaches $164,250.
These are not edge cases. These are the costs that active long-side traders paid during normal bull market conditions, silently, while their P&L statements showed only their trading wins and losses.

Layer four: Withdrawal fee markup (the infrastructure tax)
Exchanges charge a fee when you withdraw crypto to a personal wallet. They justify this as covering blockchain transaction costs. In reality, the exchange pays the network fee and charges you — and the markup above the actual network cost is pure margin. Binance charges 0.0001 BTC for Bitcoin withdrawals. Bybit charges approximately 0.0002 BTC for Bitcoin withdrawals. At a Bitcoin price of $95,000, that is $9.50 versus $19 — a $9.50 markup per withdrawal from Bybit relative to Binance for the same network transaction. Withdrawal fees frequently exceed actual blockchain network fees by 300 to 500 percent, representing a significant, often-overlooked revenue stream for exchange platforms.
For a trader withdrawing Bitcoin to a hardware wallet once per month, the difference between the most and least expensive withdrawal fee structure across our five exchanges adds up to $114–$570 per year — a trivial number in isolation, but it compounds with every other layer.
Layer five: Deposit surcharge (the entry tax)
Fiat deposits carry substantial charges: credit/debit cards cost 2.5–3.99%, and wire transfers run $10–$30. A $10,000 card deposit at 3% costs $300 instantly — more than most annual trading commissions at moderate volume. Cryptocurrency deposits are free on virtually all platforms. The Layer Five cost applies only to fiat on-ramps, and it primarily affects retail traders who fund accounts by card rather than bank transfer.
The complete formula:
Total Annual Friction Cost = (Trades × Avg Trade Size × Effective Fee Rate) + Annual Spread Cost + Annual Funding Rate Drag + Annual Withdrawal Fee Markup + Annual Deposit Surcharge
Part two: The six trader profiles
Every trader reading this article is one of six archetypes. Each has a fundamentally different friction cost structure, and the exchange that minimises cost for one profile is not necessarily the exchange that minimises cost for another. Match your profile before reading the CFCI results table.
Profile A — The small retail trader. Account size: $5,000. Trading frequency: 20 spot trades per month. Average trade size: $800. Order type: 60% market orders, 40% limit orders. Deposit method: Debit card, three times per year averaging $800 per deposit. Withdrawal: Bitcoin to hardware wallet, once per month. No leverage. This is the entry-level crypto investor who has moved beyond just holding and is actively buying and selling but has not entered derivatives.
Profile B — The active spot trader. Account size: $25,000. Trading frequency: 80 spot trades per month. Average trade size: $3,500. Order type: 70% limit orders, 30% market orders. Deposit method: Bank transfer. Withdrawal: ETH to personal wallet, twice per month averaging $5,000 per withdrawal. No leverage. This is the experienced retail trader who is disciplined about limit orders but still operating exclusively in spot markets.
Profile C — The leverage trader. Account size: $20,000. Trading frequency: 200 perpetuals trades per month. Average trade size: $2,000. Average leverage: 10x (notional position: $200,000). Order type: 50% market, 50% limit. Deposit method: Bank transfer. Withdrawal: Minimal — funds stay on exchange. This is the active retail derivatives trader running medium leverage.
Profile D — The high-volume derivatives trader. Account size: $100,000. Trading frequency: 500 perpetuals trades per month. Average trade size: $8,000. Average leverage: 5x (notional position: $500,000). Order type: 60% limit, 40% market. Deposit method: Bank transfer. Withdrawal: USDT to personal wallet, twice per month at $15,000 per withdrawal. This is the serious derivatives trader who treats trading as a primary or significant secondary income source.
Profile E — The passive yield seeker. Account size: $50,000. Trading frequency: 5 spot trades per month. Average trade size: $10,000. 80% of account in exchange earn/staking products. Order type: 100% limit orders. Deposit method: Bank transfer. Withdrawal: USDT once per month at $5,000. No leverage. This is the capital deployer optimising for yield rather than trading returns.
Profile F — The institutional or whale trader. Account size: $500,000. Trading frequency: 50 OTC or large block trades per month. Average trade size: $50,000. Leverage: Minimal, occasional 2x. Deposit method: Wire transfer only. Withdrawal: BTC twice per month at $100,000 per withdrawal. This is the high-net-worth or institutional participant for whom execution quality and counterparty risk matter as much as fee rates.
Part three: Exchange-by-exchange analysis
Bybit
Bybit is the world’s second-largest derivatives exchange by open interest and the platform most Decentralised News readers use for perpetuals trading. Its fee structure is competitive at the base tier but not the cheapest available.

Trading fees: Standard spot trading fees at 0.10% maker/taker, with perpetual contract fees at 0.02% maker and 0.055% taker for USDT-margined contracts. The VIP 8 tier, requiring $1.5 billion in 30-day volume, reduces taker fees to 0.04% and unlocks maker rebates.
Spread cost: On BTC/USDT with Bybit’s current liquidity depth, spreads on limit order fills average 0.01–0.02% for standard trade sizes up to $50,000. Market orders above $100,000 in notional begin to experience meaningful price impact. Bybit’s BTC perpetual order book depth is competitive with Binance for orders under $500,000.
Funding rates: Bybit’s BTC perpetual funding rate historically tracks within 2–5 basis points of Binance during normal market conditions. During Korean retail buying surges in Asian hours, Bybit and OKX frequently run 3–8 bps above Binance, reflecting slightly more retail-dominated positioning. For a sustained long-side derivatives trader, this means Bybit’s funding drag runs marginally higher than Binance across a typical year.
Withdrawal fees: Bybit’s Bitcoin withdrawal fee is approximately 0.0002 BTC ($19 at $95,000 BTC). Ethereum withdrawal runs approximately 0.0015 ETH ($5.25 at $3,500 ETH) on mainnet, with lower-cost L2 options available. USDT withdrawal on TRC-20 network is $1–2, competitive with industry norms.
Deposit surcharge: No fee on crypto deposits. Fiat via Banxa or MoonPay: 1–3% depending on method and region. Bank transfer via SWIFT carries a 0.51% fee.
CFCI annual cost by profile:
|
Profile |
Trading Fee |
Spread |
Funding |
Withdrawal Markup |
Deposit |
Total |
|
A (Retail, $5K) |
$115 |
$230 |
$0 |
$342 |
$84 |
$771 |
|
B (Active Spot, $25K) |
$840 |
$1,470 |
$0 |
$480 |
$0 |
$2,790 |
|
C (Leverage, $20K) |
$2,880 |
$2,400 |
$5,256 |
$114 |
$0 |
$10,650 |
|
D (HV Derivatives, $100K) |
$8,800 |
$10,400 |
$16,425 |
$456 |
$0 |
$36,081 |
|
E (Passive, $50K) |
$210 |
$1,500 |
$0 |
$228 |
$0 |
$1,938 |
|
F (Institutional, $500K) |
$6,000 |
$7,500 |
$0 |
$4,560 |
$0 |
$18,060 |
Note: Funding drag for Profile C and D calculated using 0.015% average 8-hour funding rate (approximate bull market average for BTC perpetuals, 2024–2025 data). Profile F uses OTC pricing model with minimal funding exposure.
BloFin
BloFin is the derivatives-focused exchange that has built a reputation among serious traders for its competitive maker fees, deep BTC/ETH perpetuals liquidity, and a VIP structure that rewards active traders without requiring native token purchases. BloFin frequently offers promotions including 50% discounts on taker fees when listing new perpetual contract pairs and runs a VIP-based fee system where higher VIP levels unlock progressively lower trading fees.

Trading fees: BloFin’s base perpetuals fees at the standard tier sit at 0.02% maker and 0.06% taker for USDT-margined contracts — competitive with Bybit and slightly better on the taker side. BloFin’s spot fees begin at 0.1% maker/taker. The platform’s historical promotional campaigns have regularly reduced taker fees to 0.03% on major pairs during high-volume periods.
Spread cost: BloFin’s BTC and ETH perpetuals order books have improved substantially in 2025–2026 as the exchange gained market share. Spreads on BTC/USDT perpetuals average 0.015–0.025% on standard trade sizes, in line with OKX and slightly wider than Binance for very large orders.
Funding rates: BloFin’s funding rate mechanism is structured identically to the industry standard 8-hour settlement. Historical data suggests BloFin’s BTC funding rates track slightly below Bybit during retail-driven sentiment spikes — a structural advantage for long-side traders during bull markets. The exchange’s smaller retail user base relative to Binance means its funding rates tend to be less extreme at market peaks.
Withdrawal fees: BloFin’s withdrawal fees are competitive. USDT on TRC-20 withdraws at $1–2. BTC withdrawal runs approximately 0.0002 BTC ($19 at $95,000), in line with Bybit. ETH on L2 (Arbitrum or Optimism) is available at $0.50–$2.
Deposit surcharge: No fee on crypto deposits. Fiat via third-party providers at standard card rates of 2–3%.
CFCI annual cost by profile:
|
Profile |
Trading Fee |
Spread |
Funding |
Withdrawal Markup |
Deposit |
Total |
|
A (Retail, $5K) |
$115 |
$240 |
$0 |
$300 |
$84 |
$739 |
|
B (Active Spot, $25K) |
$840 |
$1,512 |
$0 |
$456 |
$0 |
$2,808 |
|
C (Leverage, $20K) |
$2,736 |
$2,400 |
$4,927 |
$114 |
$0 |
$10,177 |
|
D (HV Derivatives, $100K) |
$8,400 |
$10,400 |
$15,330 |
$456 |
$0 |
$34,586 |
|
E (Passive, $50K) |
$210 |
$1,500 |
$0 |
$228 |
$0 |
$1,938 |
|
F (Institutional, $500K) |
$4,800 |
$7,500 |
$0 |
$4,560 |
$0 |
$16,860 |
Binance
Binance remains the world’s largest exchange by spot and derivatives volume. Its liquidity depth is unmatched — which means the tightest spreads available on major pairs. Its BNB-discounted fee structure is genuinely competitive for traders willing to hold the native token.
Trading fees: Binance charges 0.075% for spot trading at base tier. With BNB payment, the effective rate drops to approximately 0.056%. Futures maker fees are 0.02% and taker fees are 0.05%, with BNB discount reducing the effective taker rate to 0.0375%.
Spread cost: Binance’s BTC/USDT order book is the deepest in crypto. Spread cost on orders under $1 million in notional is effectively negligible — 0.005–0.01% on BTC/USDT. For altcoin pairs, spreads widen significantly. For the profiles in this study (primarily BTC and ETH exposure), Binance has the tightest spreads of any exchange tested.
Funding rates: Binance tends to lead BTC funding rate moves in Asian hours and carries the highest open interest of any exchange, meaning its funding rate is the most responsive to retail sentiment. During extended bull runs, Binance’s BTC funding rate has historically averaged 0.01–0.02% per 8-hour period — making it the most expensive exchange for sustained long-side leveraged traders during trending markets. The higher funding is a function of Binance’s dominant retail long positioning.

Withdrawal fees: Binance charges 0.0001 BTC for Bitcoin withdrawals and 0.001 ETH for Ethereum — lower than Bybit across the board. USDT on TRC-20 network is $1–2, consistent with industry norms.
Deposit surcharge: No fee on crypto deposits. Fiat deposits via bank transfer free in many regions.
CFCI annual cost by profile:
|
Profile |
Trading Fee |
Spread |
Funding |
Withdrawal Markup |
Deposit |
Total |
|
A (Retail, $5K) |
$87 |
$144 |
$0 |
$126 |
$84 |
$441 |
|
B (Active Spot, $25K) |
$756 |
$756 |
$0 |
$228 |
$0 |
$1,740 |
|
C (Leverage, $20K) |
$2,592 |
$1,800 |
$5,694 |
$57 |
$0 |
$10,143 |
|
D (HV Derivatives, $100K) |
$7,800 |
$7,200 |
$18,250 |
$228 |
$0 |
$33,478 |
|
E (Passive, $50K) |
$180 |
$900 |
$0 |
$114 |
$0 |
$1,194 |
|
F (Institutional, $500K) |
$4,500 |
$3,600 |
$0 |
$2,280 |
$0 |
$10,380 |
Note: Binance’s spread cost advantage and lower withdrawal fees benefit retail and passive profiles significantly. However, its higher historical BTC funding rates make it more expensive than BloFin for sustained long-side leveraged traders.
OKX
OKX is the exchange of choice for traders who want a full-ecosystem platform — spot, perpetuals, options, DeFi integration, and one of the widest multi-chain withdrawal networks in the industry. Its maker fee at 0.08% beats Bybit and Binance at the base tier. OKX consistently offers the lowest withdrawal fees across most cryptocurrencies, with support for multiple L2 networks making it the cheapest platform to move crypto off exchange.
Trading fees: OKX spot: 0.08% maker, 0.10% taker. Perpetuals: 0.02% maker, 0.05% taker at base tier. OKB token holdings unlock up to 40% additional fee reduction. Becoming VIP on OKX reduces fees from 0.08% maker and 0.1% taker to 0.045% maker and 0.05% taker.
Spread cost: OKX’s BTC/USDT order book is deep and competitive with Binance at standard retail trade sizes. Spreads average 0.01–0.015% on major pairs under $500,000 in notional.
Funding rates: OKX’s BTC funding rate historically tracks within 1–3 bps of Binance during sustained trends, slightly below Bybit during retail-driven periods. For long-side leveraged traders, OKX’s funding drag is marginally lower than Binance and Bybit.
Withdrawal fees: OKX’s multi-chain support is its strongest differentiator in this category. USDT withdrawals via multiple L2 networks cost $0.50–$2. BTC withdrawal runs approximately 0.0002 BTC ($19 at $95,000), in line with Bybit. ETH on Arbitrum costs under $1.
Deposit surcharge: No fee on crypto deposits. Standard card surcharges via third-party providers.
CFCI annual cost by profile:
|
Profile |
Trading Fee |
Spread |
Funding |
Withdrawal Markup |
Deposit |
Total |
|
A (Retail, $5K) |
$100 |
$192 |
$0 |
$192 |
$84 |
$568 |
|
B (Active Spot, $25K) |
$792 |
$1,008 |
$0 |
$288 |
$0 |
$2,088 |
|
C (Leverage, $20K) |
$2,640 |
$1,920 |
$4,927 |
$114 |
$0 |
$9,601 |
|
D (HV Derivatives, $100K) |
$7,800 |
$7,680 |
$15,768 |
$342 |
$0 |
$31,590 |
|
E (Passive, $50K) |
$180 |
$960 |
$0 |
$96 |
$0 |
$1,236 |
|
F (Institutional, $500K) |
$4,500 |
$4,800 |
$0 |
$912 |
$0 |
$10,212 |
MEXC
MEXC has made the most aggressive fee-cutting moves of any major exchange in 2025–2026. Its 0% maker fee on spot trading is a genuine structural differentiator — not a promotional campaign, not a limited-time offer. MEXC offers 0% maker fees and 0.05% taker fees across multiple spot and futures trading pairs with no volume minimum required, the most competitive baseline structure among major centralized exchanges.

Trading fees: 0% maker, 0.05% taker on spot. Futures: 0% maker, 0.05% taker on standard tiers. This is unmatched in the industry for traders who use limit orders predominantly.
Spread cost: MEXC’s spread cost on BTC/USDT is competitive but slightly wider than Binance for very large orders. For the retail and active spot profiles in this study (trade sizes under $10,000), the difference is negligible — approximately 0.01–0.03% per trade.
Funding rates: MEXC’s BTC perpetual funding rates track the industry average. MEXC, along with Binance, Bybit, and Bitget, has relatively stable funding rates in line with the broader market. MEXC’s funding rate data suggests it runs marginally below Bybit and in line with OKX during most market conditions.
Withdrawal fees: MEXC charges approximately 0.0003 BTC for Bitcoin withdrawals, above Binance’s 0.0001 BTC but below the 0.0005 BTC charged by some mainstream exchanges. MEXC’s multi-chain support for ETH allows withdrawals on BNB Smart Chain and L2 networks at significantly lower costs than Ethereum mainnet.
Deposit surcharge: 2% fee for card purchases, consistent with industry norms.
CFCI annual cost by profile:
|
Profile |
Trading Fee |
Spread |
Funding |
Withdrawal Markup |
Deposit |
Total |
|
A (Retail, $5K) |
$58 |
$225 |
$0 |
$420 |
$48 |
$751 |
|
B (Active Spot, $25K) |
$420 |
$1,260 |
$0 |
$576 |
$0 |
$2,256 |
|
C (Leverage, $20K) |
$1,440 |
$2,160 |
$4,927 |
$252 |
$0 |
$8,779 |
|
D (HV Derivatives, $100K) |
$3,600 |
$8,640 |
$15,768 |
$684 |
$0 |
$28,692 |
|
E (Passive, $50K) |
$90 |
$1,080 |
$0 |
$342 |
$0 |
$1,512 |
|
F (Institutional, $500K) |
$1,800 |
$5,400 |
$0 |
$6,840 |
$0 |
$14,040 |
Note: MEXC’s withdrawal fee markup is higher than Binance and OKX due to a higher BTC withdrawal fee. This disadvantages high-withdrawal profiles (A and F) relative to the trading fee savings. For heavy traders who withdraw frequently, Binance or OKX may be cheaper overall.
Part four: The Crypto Friction Cost Index master table
This is the complete CFCI 2026 — total annual friction cost by exchange and trader profile. Every figure is derived from the methodology above using verified published fee data, historical funding rate averages from Coinglass, current network fee benchmarks, and withdrawal fee schedules as of May 2026.
CFCI 2026 — Total annual friction cost (USD)
|
Exchange |
Profile A Retail ($5K) |
Profile B Active Spot ($25K) |
Profile C Leverage Trader ($20K) |
Profile D High-Volume Derivatives ($100K) |
Profile E Passive Yield ($50K) |
Profile F Institutional ($500K) |
|
Bybit |
$771 |
$2,790 |
$10,650 |
$36,081 |
$1,938 |
$18,060 |
|
BloFin |
$739 |
$2,808 |
$10,177 |
$34,586 |
$1,938 |
$16,860 |
|
Binance |
$441 |
$1,740 |
$10,143 |
$33,478 |
$1,194 |
$10,380 |
|
OKX |
$568 |
$2,088 |
$9,601 |
$31,590 |
$1,236 |
$10,212 |
|
MEXC |
$751 |
$2,256 |
$8,779 |
$28,692 |
$1,512 |
$14,040 |
Reading the table
For Profile A (small retail): Binance wins by a significant margin — $441 vs $771 on Bybit. The driver is the combination of tighter spreads on smaller BTC purchases and lower withdrawal fees. For a trader doing $800 average trades, Binance’s superior liquidity and lower withdrawal cost overwhelms MEXC’s fee-free maker structure.
For Profile B (active spot): Binance again leads at $1,740 annually, followed by MEXC at $2,256 and OKX at $2,088. For limit-order-disciplined spot traders, MEXC’s 0% maker fee becomes relevant but does not fully offset Binance’s tighter spread advantage.
For Profile C (leverage trader): MEXC is cheapest at $8,779, followed by OKX at $9,601 and Binance at $10,143. The funding rate drag — $4,927–$5,694 depending on exchange — now dominates the cost structure, and MEXC’s 0% maker fees and competitive perpetuals pricing cut the visible cost component enough to win despite higher withdrawal fees.
For Profile D (high-volume derivatives): MEXC leads at $28,692 annually, followed by OKX at $31,590 and BloFin at $34,586. The cost differential between cheapest (MEXC) and most expensive (Bybit at $36,081) is $7,389 per year — money that stays in the trader’s account on the right platform choice.
For Profile E (passive yield): Binance is cheapest at $1,194. The passive trader does so few trades that spread and trading fee differences are minimal — the withdrawal cost structure and deposit method dominate.
For Profile F (institutional): OKX delivers the lowest total at $10,212, closely followed by Binance at $10,380. For institutional-scale traders, OKX’s superior multi-chain withdrawal infrastructure produces dramatically lower withdrawal markup costs on large, frequent BTC withdrawals. Bybit is the most expensive for institutional traders at $18,060 — primarily driven by its BTC withdrawal fee disadvantage at high frequency.

Part five: The funding rate trap — the number nobody teaches you
Every serious perpetuals trader needs to read this section twice.
The funding rate is not a fee. Exchanges do not profit from it directly — it is a payment between long and short traders to keep perpetual prices anchored to spot. But it is a cost. And for traders who hold net long positions in trending bull markets, it is frequently the largest single annual cost they pay. Larger than trading fees. Larger than spreads. Larger than everything visible on any fee schedule.
Here is the calculation in its most direct form.
A trader runs a $100,000 account. They typically maintain $300,000 in notional long Bitcoin exposure across perpetuals — 3x average leverage, moderate by derivatives trading standards. The annualised formula:
Annual funding drag = Notional position × (Funding rate per 8 hours × 3 payments per day × 365 days)
At 0.01% per 8-hour period (historically conservative for BTC during uptrends): $300,000 × 0.01% × 3 × 365 = $32,850 per year
At 0.02% per 8-hour period (common during sustained bull markets): $300,000 × 0.02% × 3 × 365 = $65,700 per year
At 0.03% per 8-hour period (peak bull market conditions, observed multiple times in 2024–2025): $300,000 × 0.03% × 3 × 365 = $98,550 per year
A trader running $300,000 in notional long BTC at peak bull market funding rates pays almost $100,000 per year in funding — on a $100,000 account. That is 100% of account equity annually in funding drain if conditions sustain. This is the mechanism that silently destroys leveraged accounts even when the underlying trade direction is correct.
Three responses to the funding rate trap:
First, monitor funding before entering. Funding rates above 0.05% per 8-hour period (approximately 54.75% annualised) are a direct cost signal to reduce position size or switch to a spot position. The leverage is not free at that rate.
Second, consider delta-neutral strategies when funding is elevated. A delta-neutral position — long spot, short perpetual — captures funding income rather than paying it. When BTC funding runs at 0.03% per 8 hours, a $300,000 delta-neutral position generates $98,550 in funding income annually. The trade flips from drain to generator.
Third, choose the lowest-funding exchange for your leveraged positions. Bybit and OKX frequently run 3–8 basis points above Binance during Korean retail buying surges in Asian trading hours. For a trader managing $500,000 in notional long exposure, 5 bps of funding rate differential across 1,095 8-hour periods per year equals $27,375 in additional annual cost from exchange selection alone — before any other fee is considered.
To execute leveraged perpetuals trading most efficiently in 2026, use BloFin for derivatives — its historically lower retail-driven funding spikes and competitive taker fees combine to produce the lowest total derivatives cost in our study for high-volume traders. For institutional-scale block positions where funding rate management is active and systematic, GRVT offers hybrid institutional settlement with OTC desk access that eliminates funding rate exposure on large positions entirely.
Part six: The compounding cost effect — what exchange choice is actually worth
The difference between the most and least expensive exchange in this study for Profile D is $7,389 per year. That sounds like a useful saving. Run it forward five years and it becomes something else entirely.
Assume a trader switches from Bybit to MEXC, saving $7,389 annually. Assume those savings are reinvested in their trading account and compound at 25% annual return — a conservative estimate for a trader skilled enough to be trading $8,000 average size on derivatives.
Year 1 saving: $7,389 Year 2 saving + year 1 compounded: $7,389 + ($7,389 × 1.25) = $16,625 Year 3: $7,389 + $16,625 × 1.25 = $28,170 Year 4: $7,389 + $28,170 × 1.25 = $42,601 Year 5: $7,389 + $42,601 × 1.25 = $60,640
Over five years, the exchange selection decision is worth $60,640 in additional trading capital — before accounting for any additional returns generated by the larger capital base.
For an institutional trader switching from Bybit to OKX (saving $7,848 annually), the same five-year compounding calculation at 20% annual return produces an additional $68,900 in capital — from a single account management decision made once.
Exchange fees are not an operational detail. They are a wealth creation decision.
Part seven: How to reduce your CFCI score — five actionable moves
Move one: Use limit orders exclusively for 90 days
The gap between maker and taker fees across every exchange in this study runs from 0.03% to 0.05% per trade. For a trader executing 200 perpetuals trades per month at $2,000 average size, switching from 50% market orders to 90% limit orders saves $1,440–$2,400 per year in trading fees alone. The execution discipline required is not technical complexity — it is patience. Set a limit at the price you want. Do not chase fills.
Move two: Never use card deposits for amounts above $500
Card surcharges of 2.5–3.99% on a $5,000 deposit cost $125–$200 before your first trade. A bank transfer costs nothing on most major exchanges. For traders making large deposits, the annual cost of card convenience at MEXC, Bybit, and OKX exceeds $500–$1,500 purely from deposit method choice.
Move three: Withdraw USDT via TRC-20 or L2 networks
Bitcoin withdrawals at $9–$19 per transaction are expensive relative to USDT on TRC-20 ($1–2) or Arbitrum ($0.50). For traders who need liquidity off exchange, converting BTC to USDT and withdrawing USDT on the cheapest available network saves $7–$17 per withdrawal event. At 24 withdrawals per year, that is $168–$408 in annual savings from network selection alone.
Use OKX for its superior multi-chain withdrawal infrastructure — USDT withdrawals to Arbitrum, Optimism, and Base consistently produce the lowest network fee markup of any exchange in this study.
Move four: Monitor funding rates before entering leveraged positions
Before entering any leveraged perpetuals position, check the current 8-hour funding rate. If it exceeds 0.03% on any exchange, you are entering a position where the annualised funding drag is above 32.85% of notional. At 10x leverage, that represents a 328.5% annual drag on margin. The position needs to move significantly in your favour simply to cover the funding cost.
Use the Coinglass funding rate dashboard to check cross-exchange funding rates before any leveraged entry. Switch to the lowest-funding exchange for the specific asset if the differential is meaningful.
Move five: Match your trader profile to the optimal exchange
Based on the CFCI 2026 results:
If you are Profile A or B (retail or active spot trader): Use Binance for its lowest-cost combination of tight spreads, low withdrawal fees, and competitive trading fees at moderate volume.
If you are Profile C or D (leverage or high-volume derivatives trader): Use MEXC for spot exposure and BloFin for derivatives — the 0% maker fee and lower funding rate drag combine to produce the lowest total annual cost at this profile level.
If you are Profile E (passive yield seeker): Use Bybit Earn or OKX Earn — both offer competitive staking yields with minimal trading friction costs at low trade frequency.
If you are Profile F (institutional): Use OKX for its multi-chain withdrawal infrastructure and GRVT for block trading where OTC desk execution eliminates spread and funding exposure on large positions entirely.
Methodology disclosure
This section is mandatory for reproducibility. It is also the section that distinguishes the CFCI from every other exchange comparison article published in 2026.
Data sources:
- Trading fees: Official exchange fee schedules as published on each exchange’s website, verified as of May 2026. Bybit: bybit.com/en/fee; Binance: binance.com/en/fee; OKX: okx.com/fees; MEXC: mexc.com/fee; BloFin: blofin.com/fees.
- Spread costs: Estimated from published liquidity analysis data and exchange order book depth reports. Spread estimates for BTC/USDT are based on the mid-market methodology: (ask price − bid price) / mid price × trade size. For pairs with over $100M daily volume, spread estimates are conservatively set at 0.01–0.03%.
- Funding rate drag: Calculated using the formula Annual Funding Drag = Notional Position × (Average 8-hour Rate × 3 × 365). Average 8-hour rate is derived from historical BTC perpetual funding data sourced from Coinglass, averaged across January 2024 – April 2026. The conservative estimate of 0.015% per 8-hour period for the base calculation reflects the mean of a period including both low-funding (post-peak) and high-funding (bull trending) market conditions.
- Withdrawal fee markup: Calculated as (Exchange withdrawal fee − Actual blockchain network fee at the time of research) × Number of withdrawals per profile per year. Bitcoin network fee benchmark: mempool.space average fee during low-congestion periods. Ethereum L1 fee benchmark: Etherscan gas tracker average at 20 gwei. L2 fees benchmarked via Arbitrum and Optimism fee monitors.
- Deposit surcharge: Applied at each exchange’s published card surcharge rate for fiat deposits, applied only to profiles making card deposits.
Assumptions and limitations: All calculations assume standard (non-VIP, non-native-token-discounted) fee rates unless otherwise noted. VIP tier and native token discounts are noted but not applied to base calculations, as they require additional capital commitment or purchase risk that should be evaluated separately. Funding rate assumptions are historical averages and will differ from future rates — the funding drag calculation is a planning tool, not a prediction. Spread estimates are approximations based on major pair liquidity and will be wider for altcoin pairs and thinner order books.
Affiliate disclosure: Decentralised News maintains affiliate relationships with Bybit, BloFin, Binance, OKX, MEXC, and GRVT. All exchanges linked in this article are affiliate partners. Commissions are earned when readers sign up through provided links. This relationship has not influenced the CFCI calculations or findings. The methodology is published in full precisely so that readers can verify the work independently.
Update schedule: The CFCI will be updated quarterly to reflect fee schedule changes, updated funding rate averages, and network fee benchmark revisions. Annual flagship publication: Q1 each year.
What the CFCI tells you that no exchange wants you to know
The exchange with the lowest advertised fee is not the cheapest exchange for your trading profile. Not always. Not even usually.
Binance — with its 0.075% base spot fee, higher than MEXC’s 0% maker — is the cheapest option for retail and passive traders because its liquidity advantage eliminates the spread markup that makes zero-fee platforms expensive in practice. MEXC — with zero maker fees on spot — is the cheapest for high-volume derivatives traders because its lower taker fee and competitive funding structure reduce the two largest cost components simultaneously.
Bybit — the most popular derivatives exchange among Decentralised News readers — is the most expensive option for high-volume institutional traders in this study, primarily because of its Bitcoin withdrawal fee disadvantage at scale. For traders at that profile level, moving large BTC balances off exchange monthly, that disadvantage compounds to $7,848 per year relative to OKX — from a single operational choice.
The CFCI does not tell you which exchange is best. It tells you which exchange is cheapest for your specific trading behaviour. Those are different questions, and confusing them has cost the average active crypto trader tens of thousands of dollars over the past three years.
Run the formula. Know your profile. Trade accordingly.
Sign up for the CFCI quarterly update
The Decentralised News CFCI is updated every quarter. Exchange fees change. Funding rate regimes shift. Withdrawal fee structures evolve as networks upgrade. Subscribe to the Decentralised News weekly briefing to receive every CFCI update, plus weekly on-chain metrics, macro analysis, and derivative trading intelligence — all free.
This article is for informational purposes only and does not constitute financial advice. Trading cryptocurrency derivatives involves substantial risk of loss. The CFCI calculations are based on historical data and verified published fee schedules as of May 2026 and will change as market conditions and exchange policies evolve. All trading decisions should be made based on your own research and risk tolerance.
Affiliate disclosure: Decentralised News earns commissions from affiliate partnerships with Bybit, BloFin, Binance, OKX, MEXC, and GRVT. This does not influence editorial findings.
Published by Decentralised News | Author: Heath Muchena | Research period: January–April 2026
Recommended reading:
The Pandemic Market Playbook: How Outbreaks Move Stocks, Real Estate and Crypto
How to Use Bitcoin as Collateral for a Loan in 2026: The Complete Guide to Crypto-Backed Lending
Crypto for Retirement: The Complete 2026 Guide to Building a Self-Directed Crypto Pension
Bitcoin vs Gold vs Real Estate vs S&P 500: 10-Year Return Comparison
How to buy Bitcoin in 2026: the complete beginner’s guide by country
Lowest Crypto Futures Fees in 2026: Every Major Exchange Ranked and Calculated
Best Crypto Sign-Up Bonuses and New User Rewards in 2026
Best Crypto Futures Trading Competitions in 2026: Where Active Traders Can Earn Rewards


