
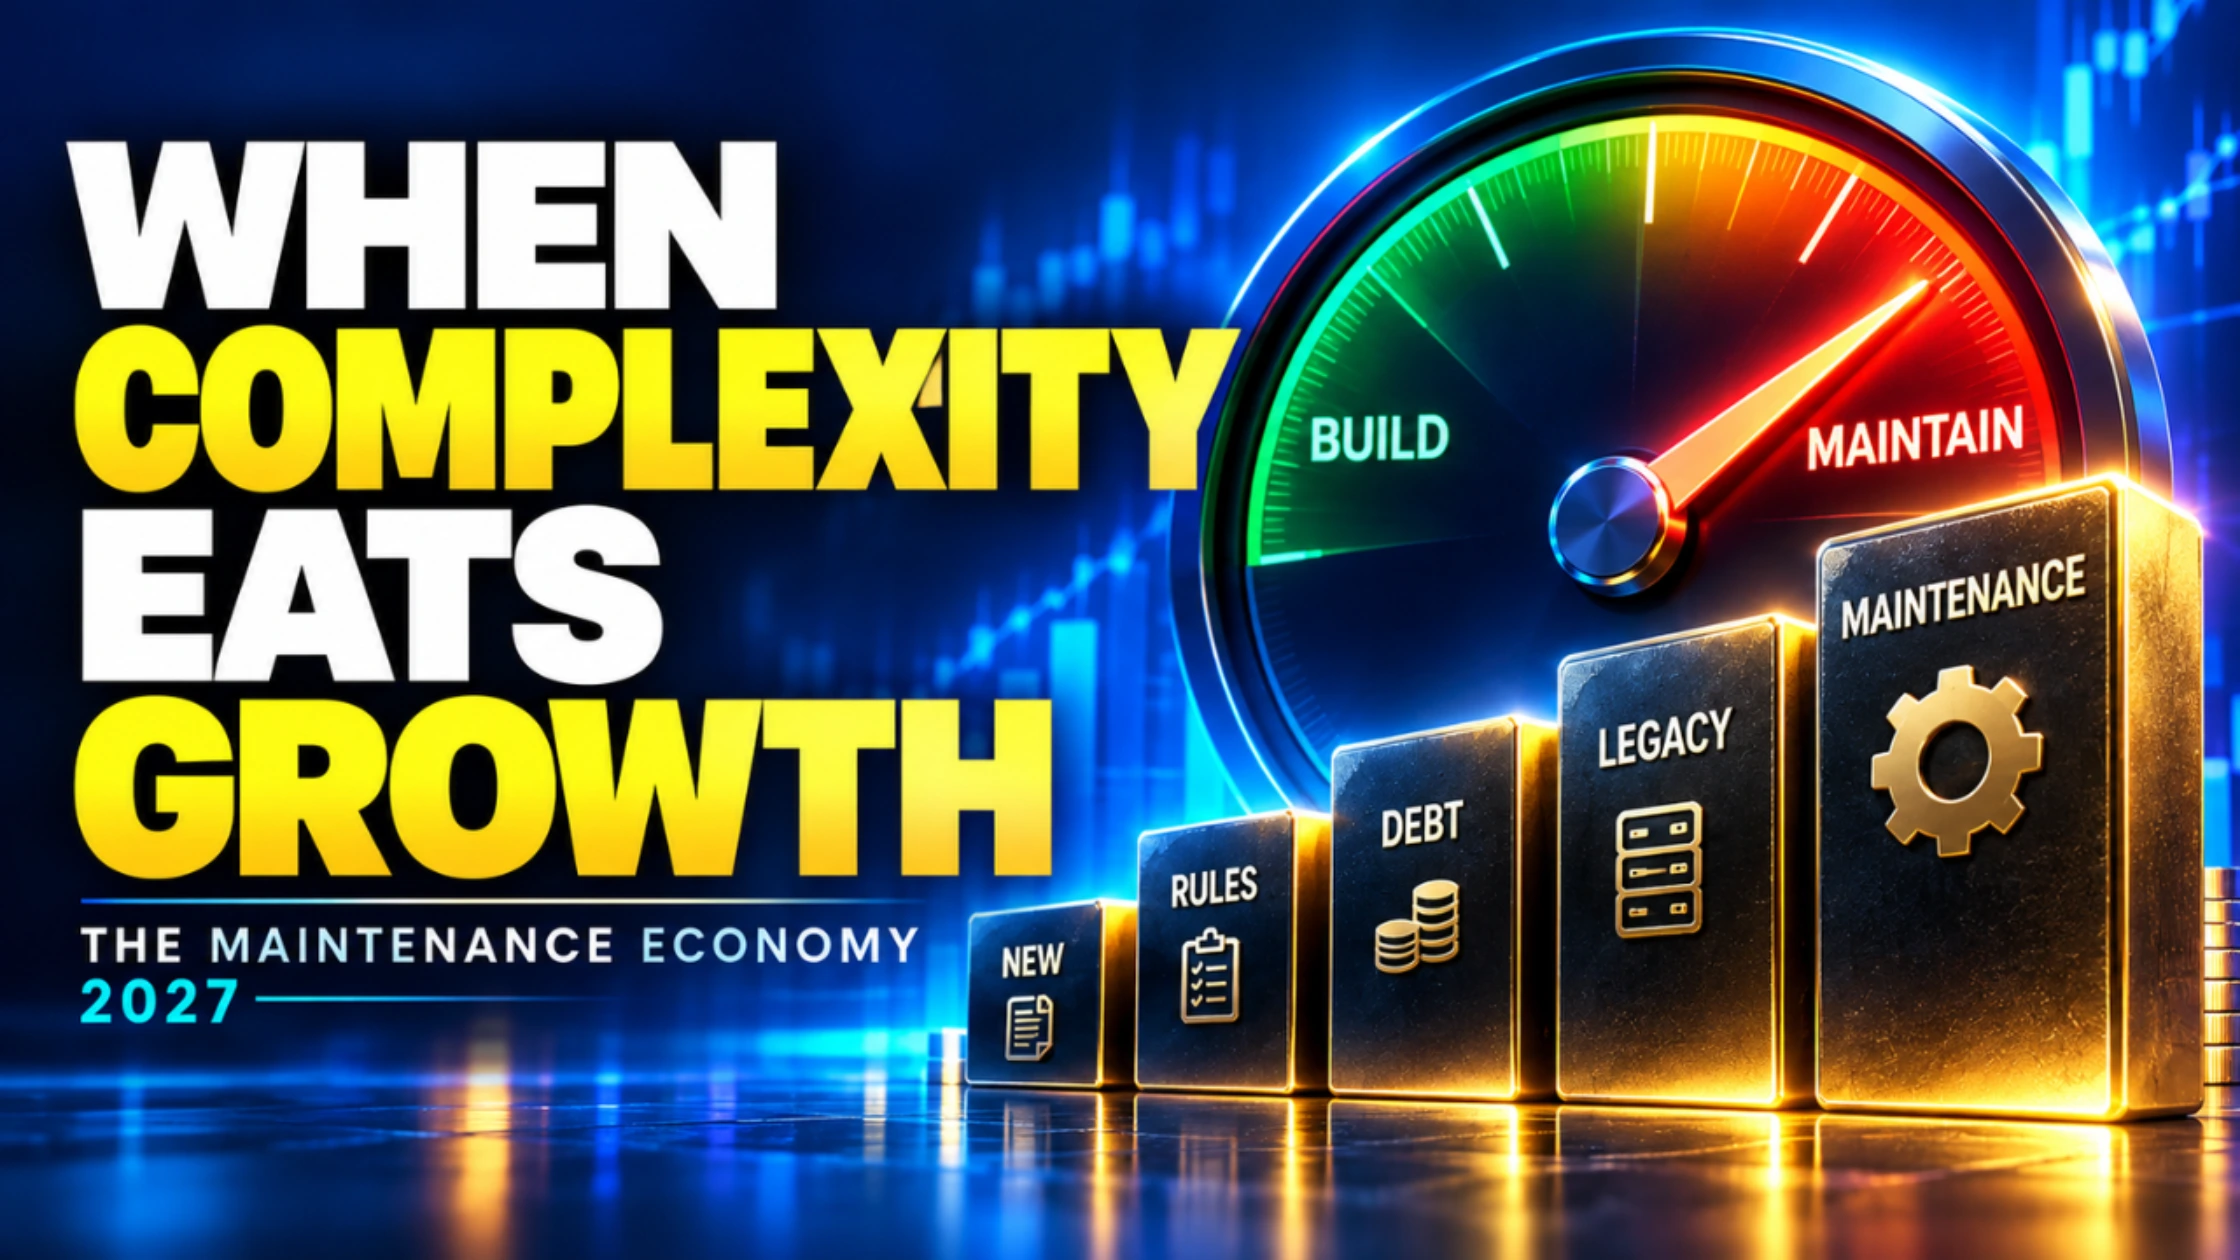
The Maintenance Economy: When Complexity Starts Consuming the Growth It Was Built to Protect
Modern economies do not need to collapse for complexity to become expensive. They can remain rich, functional and technologically advanced while quietly shifting more labour, capital and management attention from building new capacity toward maintaining the systems, rules, obligations and software accumulated during earlier periods of growth.
The Signal
- The useful historical question is not whether civilizations share a predetermined lifespan. There is no credible economic reason to treat a 250-year empire cycle as a mechanical forecasting law.
- A much stronger mechanism comes from Joseph Tainter: societies solve problems by adding complexity, but the marginal return on each additional layer can eventually decline.
- The modern version need not end in collapse. It can produce a Maintenance Economy, where more resources are required simply to operate systems already built.
- OECD research published in 2026 estimates that regulation-related tasks accounted for about 4.2% of the US wage bill in 2024, up from 4.0% in 2012. The OECD associates that increase with weaker labour productivity and business dynamism.
- The problem is not simply "too much regulation." Fragmentation, duplicated reporting, overlapping requirements, legacy processes and failure to retire obsolete rules can all enlarge what DN calls the Administrative Surface Area.
- Similar maintenance loads appear in public budgets, healthcare administration, legacy software, infrastructure and corporate operating systems.
- AI creates a fork in the road. It could become the largest Complexity Compressor in decades, or allow institutions to produce rules, documentation, software and controls faster than they can retire them.
- DN calls the point where the incremental cost of maintaining added complexity begins to exceed its incremental productive benefit the Complexity Break-Even Point.
DN Evidence Block
- Research window: historical framework plus economic evidence through September 2026.
- Regulation: OECD task-based estimates for the United States, Europe and Australia.
- Fiscal structure: Congressional Budget Office 2026 baseline and OECD/IMF demographic analysis.
- Healthcare: 2026 US hospital administrative-cost evidence.
- Public investment: IMF analysis of expenditure allocation and investment efficiency.
- Digital simplification: 2026 IMF research on public-administration digitalisation and OECD research on government AI adoption.
- Method: the article treats complexity as productive when benefits exceed costs and focuses on accumulated maintenance burden rather than institutional size alone.
The 250-Year Clock Is the Least Useful Part of the Story
Historical-cycle theories are attractive because they turn an impossibly complicated world into a clock.
Sir John Glubb famously observed that several historical powers could be described as enjoying roughly 250 years of national greatness.
But even Glubb acknowledged that his starting and ending dates were largely arbitrary.
The Roman Republic, imperial Rome, Britain, Spain, Persia and the Ottoman Empire were different political systems operating under radically different technologies, institutions and definitions of power.
Treating their selected dates as a universal expiry timer creates precision that the underlying history cannot support.
That does not make the broader historical literature useless.
It means the interesting part is not the date.
It is the mechanism.
The Mechanism That Survives: Declining Returns to Complexity
Joseph Tainter's framework is more economically useful.
Societies are problem-solving systems.
A problem appears.
The system responds.
A drought produces water infrastructure.
Financial instability produces supervision.
Fraud produces reporting requirements.
A security failure produces another control.
A new technology produces another regulator, standard or compliance process.
These responses can be entirely rational.
Many are valuable.
The first layer of complexity may produce enormous returns.
The second may produce slightly less.
Eventually the system can encounter diminishing marginal returns.
The next problem is solved by adding another layer to a machine already carrying dozens.
That new layer must interact with everything underneath it.
The cost is no longer only the new rule, office or system.
It is the cost of integration.
The hidden cost of mature institutions is not simply the size of each new intervention. It is the interaction cost between accumulated interventions. Complexity compounds because every additional layer must coexist with the layers that came before it.
The Maintenance Economy
DN calls the mature version of this process the:
Maintenance Economy.
It is an economy where a growing share of scarce resources is allocated not to expanding productive capacity but to preserving, reconciling and administering the accumulated architecture of the existing system.
That burden can include:
- regulatory compliance,
- reporting,
- legacy software,
- debt service,
- old infrastructure,
- entitlement obligations,
- cybersecurity controls,
- licensing systems,
- procurement processes,
- legal reconciliation,
- and organizational handoffs.
These things are not equivalent.
Nor are they necessarily waste.
Healthcare benefits are not the same thing as duplicated paperwork.
Maintaining a bridge is not the same thing as maintaining an obsolete software integration.
Debt interest is a contractual payment, not administrative overhead.
But economically they can share one characteristic:
they reduce the amount of today's resources that can be freely redirected toward tomorrow's priorities.
The Important Variable Is Flexibility
A young system typically has substantial flexibility.
Capital can be directed toward new infrastructure.
Workers can be reassigned.
Software can be replaced.
Rules are relatively simple.
The number of inherited commitments is limited.
A mature system carries history.
Every past decision can create a future claim.
Some claims are valuable protections.
Some are debts.
Some are pensions.
Some are regulations.
Some are APIs.
Some are databases.
Some are organizations whose original purpose remains important.
Others persist because removing complexity is politically, technically or operationally harder than adding it.
Every Solution Leaves a Residue
This is one of the asymmetries of institutional design.
It is often easier to create a rule than delete one.
Easier to launch a program than close it.
Easier to add a software feature than remove the dependencies it creates.
Easier to add a reporting requirement after a failure than prove years later that the reporting requirement no longer adds enough value.
The result is a growing:
Rule Stack.
The OECD's recent work on regulatory complexity describes precisely this problem.
New rules frequently arrive on top of existing frameworks.
Requirements accumulate.
Reporting becomes fragmented.
Different agencies may ask for similar information in different formats.
Firms must interpret multiple overlapping regimes.
The direct cost of each rule may be modest while the combined administrative surface becomes large.
Institutional complexity behaves more like a software stack than a pile of paper. What matters is not the number of rules alone, but their dependency graph, overlaps, exceptions, interfaces and required handoffs.
Regulatory Labour Is Now Measurable
A 2026 OECD working paper attempts to measure regulatory compliance from the bottom up by identifying occupations and tasks associated with compliance.
For the United States, it estimates that the wage share devoted to regulation-related tasks increased from 4.0% in 2012 to 4.2% in 2024.
The movement sounds small.
Across a vast economy it is not.
The same research estimates around 3.9% of employment in selected European economies was connected to regulatory tasks in 2023.
Most importantly, the OECD's econometric analysis associates the US increase since 2012 with around a 0.5% decline in labour productivity and a 0.4 percentage-point reduction in the share of workers employed by young firms.
Association is not proof that all regulation destroys productivity.
The OECD explicitly stresses that good regulation can improve markets, correct failures and produce social benefits.
The finding is more subtle.
Compliance consumes real labour.
And the opportunity cost of that labour matters.
The Complexity Tax Is Paid in Talent
The most expensive administrative burden is not necessarily the invoice.
It can be the person doing the work.
A highly skilled engineer filling out duplicative forms is not engineering.
A physician navigating billing rules is not treating a patient.
A founder interpreting overlapping licensing requirements is not building the product.
A public servant manually reconciling incompatible databases is not designing policy.
This produces what DN calls:
Talent Diversion.
The real complexity tax is often not administrative spending. It is the productive opportunity foregone when scarce skilled labour is redirected from creation toward navigation.
Healthcare Shows How Rational Solutions Can Stack
US healthcare offers a particularly useful example because many layers of administration originated as attempts to improve something real.
Insurers monitor utilization.
Providers document services.
Governments measure quality.
Hospitals report outcomes.
Payment models attempt to reward value rather than volume.
None of those objectives is inherently irrational.
Yet each can generate its own infrastructure.
A 2026 JAMA Health Forum study examined mandatory value-based payment programs and found participation was associated with increased administrative costs.
Across the programs studied, the researchers estimated more than $3 billion in additional annual administrative costs nationally.
The study does not establish that the programs lacked benefits.
It reveals a critical accounting problem.
A reform intended to improve efficiency can itself create a new administrative layer.
The gross benefit and the complexity cost must both be measured.
The Reform Overhead Paradox
DN calls this the:
Reform Overhead Paradox.
A reform is introduced to fix a costly problem.
The reform requires:
- new reporting,
- new metrics,
- new software,
- new staff,
- new audits,
- new dispute procedures,
- and new interfaces with existing systems.
The original problem may improve.
But part of the gain is consumed by the machinery used to produce it.
This does not imply that reform should stop.
It implies that every reform should include a complexity budget.
The Complexity Budget
Traditional cost-benefit analysis asks:
What will this intervention cost?
What benefit will it generate?
The Maintenance Economy requires additional questions.
How many permanent tasks does it create?
How many new interfaces?
How many agencies or teams must coordinate?
How much data must be reported repeatedly?
Which old process disappears when the new one arrives?
What is the retirement date?
What happens if the policy succeeds?
Does the administrative layer shrink?
Or does success make it permanent?
Every major institutional intervention should carry a Complexity Budget: an explicit estimate of the permanent administrative surface it creates and the legacy processes it is expected to retire.
The Fiscal Version of the Maintenance Economy
Public budgets have their own version of accumulated commitments.
Consider the United States as an illustration, not as an argument about any particular political administration.
CBO projects mandatory spending at roughly 60% of federal outlays in fiscal 2026.
Net interest is projected to exceed $1 trillion, equal to around 3.3% of GDP.
By 2036, CBO's baseline puts interest at 4.6% of GDP.
Mandatory programs provide important benefits and interest payments honour existing contractual obligations.
Neither should simply be classified as waste.
But they illustrate the concept of:
Legacy Claims.
A large part of future fiscal capacity has already been claimed by decisions, demographics and liabilities inherited from the past.
The Legacy Claim Ratio
DN defines the Legacy Claim Ratio conceptually as the share of future resources already committed before policymakers decide what new priorities deserve funding.
That can include:
- interest obligations,
- statutory benefit formulas,
- existing contracts,
- maintenance requirements,
- and other difficult-to-reallocate commitments.
The higher the ratio, the less fiscal optionality remains.
Again, this says nothing by itself about whether the underlying commitment is desirable.
It measures flexibility.
Demographics Add a Predictable Maintenance Load
Ageing makes this problem more structural.
Across OECD countries, the number of people aged 65 and older for every 100 working-age adults is projected to rise sharply over coming decades.
OECD estimates suggest ageing could increase annual pension and healthcare spending by about 3% of GDP by 2060.
This is not a policy mistake.
It is arithmetic.
Older populations require more healthcare and retirement support while the relative size of the working-age population declines.
The significance for the Maintenance Economy is straightforward.
More future output is needed simply to honour the existing social architecture.
Demographic ageing can create a Maintenance Demand Shock. Even with unchanged policy, a mature society must allocate more resources to operating inherited social systems before funding new priorities.
The Opportunity Cost Appears in Investment
The mirror image of maintenance is expansion.
Roads.
Power grids.
Housing.
Research.
Education.
Digital infrastructure.
New businesses.
Productive investment builds future capacity.
IMF analysis published in 2025 found that public investment's share of government expenditure had declined by roughly two percentage points over the preceding two decades.
Its broader fiscal analysis suggests governments could obtain materially more output from existing spending through better allocation and efficiency.
For advanced economies, the IMF estimates that reallocating 1% of GDP from lower-impact government consumption into infrastructure investment could raise output by around 1.5% over the long term.
The question is therefore not simply:
How large is government?
It is:
What proportion of resources maintains the inherited system and what proportion expands future productive capacity?
The Maintenance-to-Expansion Ratio
DN calls this the:
Maintenance-to-Expansion Ratio.
It can apply to governments.
It can apply to companies.
It can apply to a software team.
It can even apply to infrastructure.
If a company spends $80 maintaining old systems for every $20 creating new capability, the ratio is 4:1.
That may be temporarily rational.
But if the ratio keeps climbing, innovation becomes increasingly difficult.
Corporations Have the Same Disease: Technical Debt
Software engineers already have a name for accumulated complexity.
Technical debt.
A temporary workaround solves today's problem.
Then another application depends on it.
Then a data pipeline is connected.
Then a compliance control is added.
Then the original developer leaves.
Five years later, replacing the workaround requires changing half the organization.
The original decision may have been completely rational.
Its maintenance cost was simply deferred.
This is Tainter's mechanism in code.
Technical debt and institutional complexity are versions of the same economic phenomenon: past problem-solving creates future maintenance liabilities.
The Complexity Interest Rate
Financial debt has interest.
Complexity does too.
Every legacy system requires:
- support,
- integration,
- staff knowledge,
- testing,
- security,
- documentation,
- and compatibility work.
DN calls this recurring burden the:
Complexity Interest Rate.
An organization can continue adding systems while appearing productive.
Eventually each new project begins by paying interest on the architecture already there.
Progress slows even if the workforce becomes more capable.
Growth Can Hide Complexity for a Long Time
A rapidly growing organization can carry extraordinary inefficiency.
Revenue expands faster than overhead.
Tax receipts rise.
New workers arrive.
Capital is plentiful.
The maintenance burden is present, but growth outruns it.
The problem becomes visible when growth slows.
The denominator stops rescuing the system.
Then previously tolerable overhead becomes structural.
The Complexity Break-Even Point
This leads to the central DN concept.
The:
Complexity Break-Even Point.
It is the point where the expected benefit from another institutional layer is no longer clearly larger than:
- its direct operating cost,
- its compliance cost,
- its coordination cost,
- its integration cost,
- its opportunity cost,
- and its future retirement cost.
The break-even point is not universal.
Financial regulation will tolerate more complexity than a coffee shop licence.
Nuclear safety demands more controls than a low-risk consumer application.
The principle is marginal.
Does the next layer still create more value than it consumes?
This Is Why Counting Rules Is Not Enough
One thousand simple, harmonized rules may be easier to operate than 100 contradictory ones.
Ten agencies using the same reporting standard may impose less burden than three agencies requiring incompatible submissions.
Complexity therefore has several dimensions.
| Dimension | What increases it? | Economic consequence |
|---|---|---|
| Rule volume | More requirements | More information to understand |
| Fragmentation | Multiple authorities and standards | Duplicated work |
| Handoffs | More approvals and interfaces | Longer cycle times |
| Legacy dependency | Old systems remain critical | Higher maintenance cost |
| Exception density | More carve-outs and special cases | Harder automation |
| Reporting frequency | Repeated evidence requirements | Labour diversion |
| Policy overlap | Several solutions target the same problem | Reconciliation burden |
| Retirement failure | Old rules survive new replacements | Permanent Rule Stack growth |
The Administrative Surface Area
DN calls the total number of interfaces an organization must continuously maintain its:
Administrative Surface Area.
A firm operating across multiple jurisdictions can face:
- tax authorities,
- employment rules,
- privacy requirements,
- industry regulators,
- licensing authorities,
- banks,
- auditors,
- insurers,
- vendors,
- cybersecurity frameworks,
- and internal control functions.
Again, many are essential.
The problem arises when interfaces multiply faster than coordination technology improves.
Then AI Arrives
Artificial intelligence could radically change the Maintenance Economy.
Routine information processing and administrative work are among the occupational categories most exposed to current AI capabilities, according to OECD research.
Governments are already adopting AI for:
- document classification,
- workflow optimization,
- fraud detection,
- tax administration,
- case triage,
- and public-service delivery.
More than half of OECD countries responding to a recent fiscal survey reported using or planning AI to automate repetitive government tasks and redirect staff toward higher-value work.
This creates enormous simplification potential.
AI as a Complexity Compressor
Consider what an AI-native administration could do.
A company reports the same information once.
Different agencies retrieve only the fields they are legally permitted to use.
Forms prepopulate automatically.
An agent explains which rules apply.
Low-risk applications receive automatic processing.
Inspections become risk-based.
Duplicate requirements are detected across agencies.
Legacy regulation is periodically compared with actual outcomes.
The system becomes easier without becoming unregulated.
This is:
Complexity Compression.
There Is Real Evidence That Digital Simplification Can Matter
A 2026 IMF working paper examined state-level public-administration digitalisation in India.
The reforms included tax filing, permits, environmental and labour regulation, inspections, commercial disputes and single-window systems.
The researchers found higher average microenterprise productivity in states implementing more digitalisation.
This matters because digitisation did not require eliminating the underlying state functions.
It reduced the friction required to interact with them.
The most important administrative AI opportunity may not be replacing government. It may be preserving institutional protections while radically reducing the transaction cost of complying with them.
But AI Can Also Make the Problem Worse
There is a dangerous alternative.
AI makes document production cheap.
It makes monitoring cheap.
It makes rule drafting cheap.
It makes software features cheap.
It makes reporting cheap.
And when the marginal cost of creating complexity falls, institutions may create more of it.
An agency that once requested 20 data fields can request 200 because software can process them.
A company can deploy 1,000 internal controls because agents can monitor them.
Developers can create features faster than architecture teams can retire dependencies.
AI can therefore lower the cost of complexity creation faster than it lowers the cost of complexity ownership.
The AI Complexity Paradox
DN calls this the:
AI Complexity Paradox.
The technology capable of simplifying mature institutions can also allow them to accumulate rules, code and controls at unprecedented speed.
This is already visible in software engineering.
Agentic development can accelerate code creation.
But faster creation does not automatically mean faster verification, architectural simplification or retirement of old systems.
If output outruns governance, technical debt can grow faster.
AI productivity should not be measured only by how quickly institutions can create. It must also measure how effectively they can delete, consolidate, retire and simplify.
The Missing Productivity Metric Is Deletion
Modern institutions celebrate launches.
New product.
New program.
New regulation.
New control.
New dashboard.
New application.
But mature systems may need another productivity metric:
How much obsolete architecture did you safely remove?
DN calls this the:
Complexity Retirement Rate.
A healthy system should not only measure how quickly it adds solutions.
It should measure how quickly it retires complexity whose benefit no longer exceeds its cost.
The Rule Stack Drift
If rules and processes grow 5% per year while only 1% are retired or consolidated, the effective Rule Stack is drifting upward.
The exact numbers will differ by institution.
The concept matters more than the figure.
A system with no retirement mechanism has only one long-run direction.
More.
Institutional Refactoring
Software developers periodically refactor code.
They preserve functionality while changing the underlying architecture to make it simpler, cleaner and easier to maintain.
Institutions need the equivalent.
DN calls it:
Institutional Refactoring.
The objective is not indiscriminate deregulation.
It is preservation of outcomes with fewer interfaces.
That can mean:
- combining reporting systems,
- removing duplicate requirements,
- standardizing data formats,
- sunsetting rules after review,
- closing obsolete programs,
- modernizing legacy software,
- consolidating approval chains,
- sharing verified data between authorized institutions,
- and redesigning services around the user rather than around agency boundaries.
The Simplification Dividend
When complexity is reduced without reducing useful outcomes, capacity is released.
That capacity can appear as:
- lower operating cost,
- faster approvals,
- more entrepreneurship,
- greater public investment,
- more engineering time,
- shorter healthcare workflows,
- or more responsive public services.
DN calls that recovered capacity the:
Simplification Dividend.
It is the economic value liberated by removing coordination and maintenance work that no longer provides commensurate benefit.
The Maintenance Economy Is an Investment Theme Too
If the thesis is right, several categories become strategically important.
Enterprise modernization
Organizations need to retire brittle legacy systems before layering AI on top of them.
Compliance automation
The winning platforms may not eliminate regulation but make compliance machine-readable and reusable.
GovTech
Single-window services, automated forms, shared data and digital identity can compress administrative surface area.
Infrastructure maintenance technology
Ageing physical systems need better predictive maintenance rather than ever-larger emergency repair budgets.
AI agents
Agents can absorb navigation work currently performed manually across fragmented systems.
Data interoperability
Many bureaucratic costs exist because institutions cannot safely reuse information already collected elsewhere.
Cybersecurity automation
A more digital state requires stronger controls, but those controls must themselves avoid becoming another manual complexity layer.
The DN Maintenance Economy Monitor
Signals Worth Tracking
Track the macro signals behind the Maintenance Economy
Productivity, rates, government debt, infrastructure investment and technology spending are all relevant to the thesis. TradingView can be used to monitor cross-market macro indicators, while ASCN provides AI-agent automation workflows. Affiliate links.
DN Maintenance Economy Stress Engine
The tool below does not attempt to predict national decline.
It tests a narrower proposition.
How heavily is an organization, economy or institution weighted toward maintaining inherited complexity rather than expanding productive capacity?
Maintenance Economy Stress Engine
Model maintenance load, expansion headroom, Rule Stack Drift, legacy lock-in, administrative surface area and the theoretical capacity that simplification could release.
Calculating...
What the Engine Is Really Measuring
The central output is not government size.
It is not corporate headcount.
It is not the number of regulations.
It is the balance between:
preserving yesterday's architecture
and
building tomorrow's productive capacity.
A complex economy can score well if its complexity creates high returns and obsolete layers are continually retired.
A smaller institution can score poorly if it is fragmented, rigid and dominated by legacy systems.
Complexity Yield Matters More Than Complexity Volume
Some of the world's most productive sectors are extremely complex.
Semiconductor manufacturing is complex.
Commercial aviation is complex.
Modern financial markets are complex.
Nuclear engineering is complex.
The lesson is not:
simpler is always better.
The lesson is:
complexity must keep earning its cost.
DN calls that:
Complexity Yield.
The relevant economic question is not whether a system is complex. It is whether its Complexity Yield remains positive after accounting for administration, integration, coordination and maintenance.
What Would Prove This Thesis Wrong?
The Maintenance Economy thesis weakens materially if:
- regulatory compliance shares decline while productivity remains weak,
- mature economies increase productive investment without needing institutional simplification,
- greater regulatory accumulation is consistently associated with stronger firm entry and business dynamism,
- legacy IT and administrative complexity cease to consume meaningful skilled labour,
- ageing-related fiscal pressures are absorbed without reducing fiscal flexibility,
- AI automation rapidly eliminates maintenance work faster than institutions create new complexity,
- or economies with the highest maintenance burdens systematically outperform less burdened peers after controlling for other factors.
There is also an important counterargument.
Some apparent complexity may be the price of living in a richer society with higher standards for:
- safety,
- privacy,
- environmental quality,
- financial stability,
- consumer protection,
- healthcare quality,
- and accountability.
If the benefits rise as quickly as the administrative cost, complexity may still be economically rational.
That is precisely why the framework focuses on marginal return rather than rule count.
The Bigger Conclusion
The historical-cycle story is seductive because it asks:
Is civilization declining?
That may be the wrong question.
A better one is:
How much of today's productive capacity is being consumed by yesterday's solutions?
That question can actually be measured.
It can be asked about a country.
A healthcare system.
A bank.
A software company.
A government agency.
Or an individual corporation.
Mature systems accumulate history.
History produces obligations.
Obligations produce maintenance.
Maintenance consumes capacity.
Eventually the system can reach a point where adding another solution produces less benefit than the machinery required to integrate it.
That is the Complexity Break-Even Point.
And unlike an empire's supposed 250-year clock, it is not destiny.
Complexity can be retired.
Software can be refactored.
Processes can be consolidated.
Reporting can become interoperable.
Infrastructure can be modernized.
AI can eliminate repetitive administration.
Rules can be reviewed against outcomes.
The Maintenance Economy does not require collapse.
It requires accounting.
Because the biggest risk facing a mature system may not be that it suddenly stops working.
It may be that the system continues working perfectly well while an ever-larger share of its energy is required simply to keep it working.
Primary Sources & Evidence
- Joseph A. Tainter, The Collapse of Complex Societies, Cambridge University Press.
- OECD Economics Department Working Paper No. 1856, Regulatory Compliance Costs and Productivity: New Task-Based Evidence, January 2026.
- OECD Economic Outlook, Time for a Regulatory Reset?, 2025.
- OECD, Smart Regulations, Strong Business, 2026.
- OECD, Digital Government Outlook 2026.
- OECD, Building an AI-Ready Public Workforce, January 2026.
- OECD Employment Outlook 2025, population-ageing analysis.
- IMF Fiscal Monitor, Spending Smarter, October 2025.
- IMF Working Paper, Public Administration Digitalisation and Microenterprise Productivity in India, May 2026.
- Congressional Budget Office, The Budget and Economic Outlook: 2026 to 2036, February 2026.
- JAMA Health Forum, Mandatory Value-Based Payment Programs and Hospital Administrative Costs, August 2026.
- McKinsey & Company research on enterprise technical debt, application maintenance and enterprise technology productivity.
- Sir John Glubb, The Fate of Empires and Search for Survival, used as historical framing rather than a forecasting model.
Frequently Asked Questions
What is the Maintenance Economy?
The Maintenance Economy is a Decentralised News framework describing a system in which a growing share of labour, capital and organizational attention is required to operate accumulated rules, obligations, infrastructure, software and administrative processes rather than creating new productive capacity.
What is the Complexity Break-Even Point?
The Complexity Break-Even Point is the point at which the expected incremental benefit of adding another institutional or organizational layer becomes comparable to or smaller than its direct, administrative, coordination, integration and future maintenance costs.
Does the thesis argue that regulation is bad?
No. Regulation can correct market failures, protect people, increase trust and improve economic performance. The thesis concerns poorly managed accumulation, duplication, fragmentation and the failure to retire requirements whose benefits no longer justify their costs.
What is Complexity Yield?
Complexity Yield is DN terminology for the productive or protective benefit generated by a system relative to the ongoing resources required to operate its complexity.
What is the Maintenance-to-Expansion Ratio?
The Maintenance-to-Expansion Ratio compares resources devoted to preserving existing systems with resources directed toward building new productive capacity.
Can AI reduce institutional complexity?
Potentially. AI can automate repetitive administrative work, prepopulate forms, reconcile data, support risk-based inspections and help users navigate complex rules. However, AI can also make it easier to generate new rules, controls, software and documentation, potentially increasing complexity if institutions do not actively retire obsolete layers.
What is Institutional Refactoring?
Institutional Refactoring is the process of simplifying the architecture of an institution while attempting to preserve useful outcomes, similar to refactoring software code without removing its required functionality.
Is there really a 250-year lifespan for empires?
There is no established economic or historical law requiring empires to decline after 250 years. Sir John Glubb identified an approximate pattern using selected historical examples, but even his own dates involved subjective choices. DN treats that idea as historical framing rather than a forecasting model.





