The DN Cycle Entropy Index: A Six-Gauge Reading of the Bitcoin Cycle Bottom
The Bitcoin Bottom Dashboard: What On-Chain, Macro and Sentiment Data Say Now.
The Entropy Bottom: Where the Crypto Cycle Actually Is
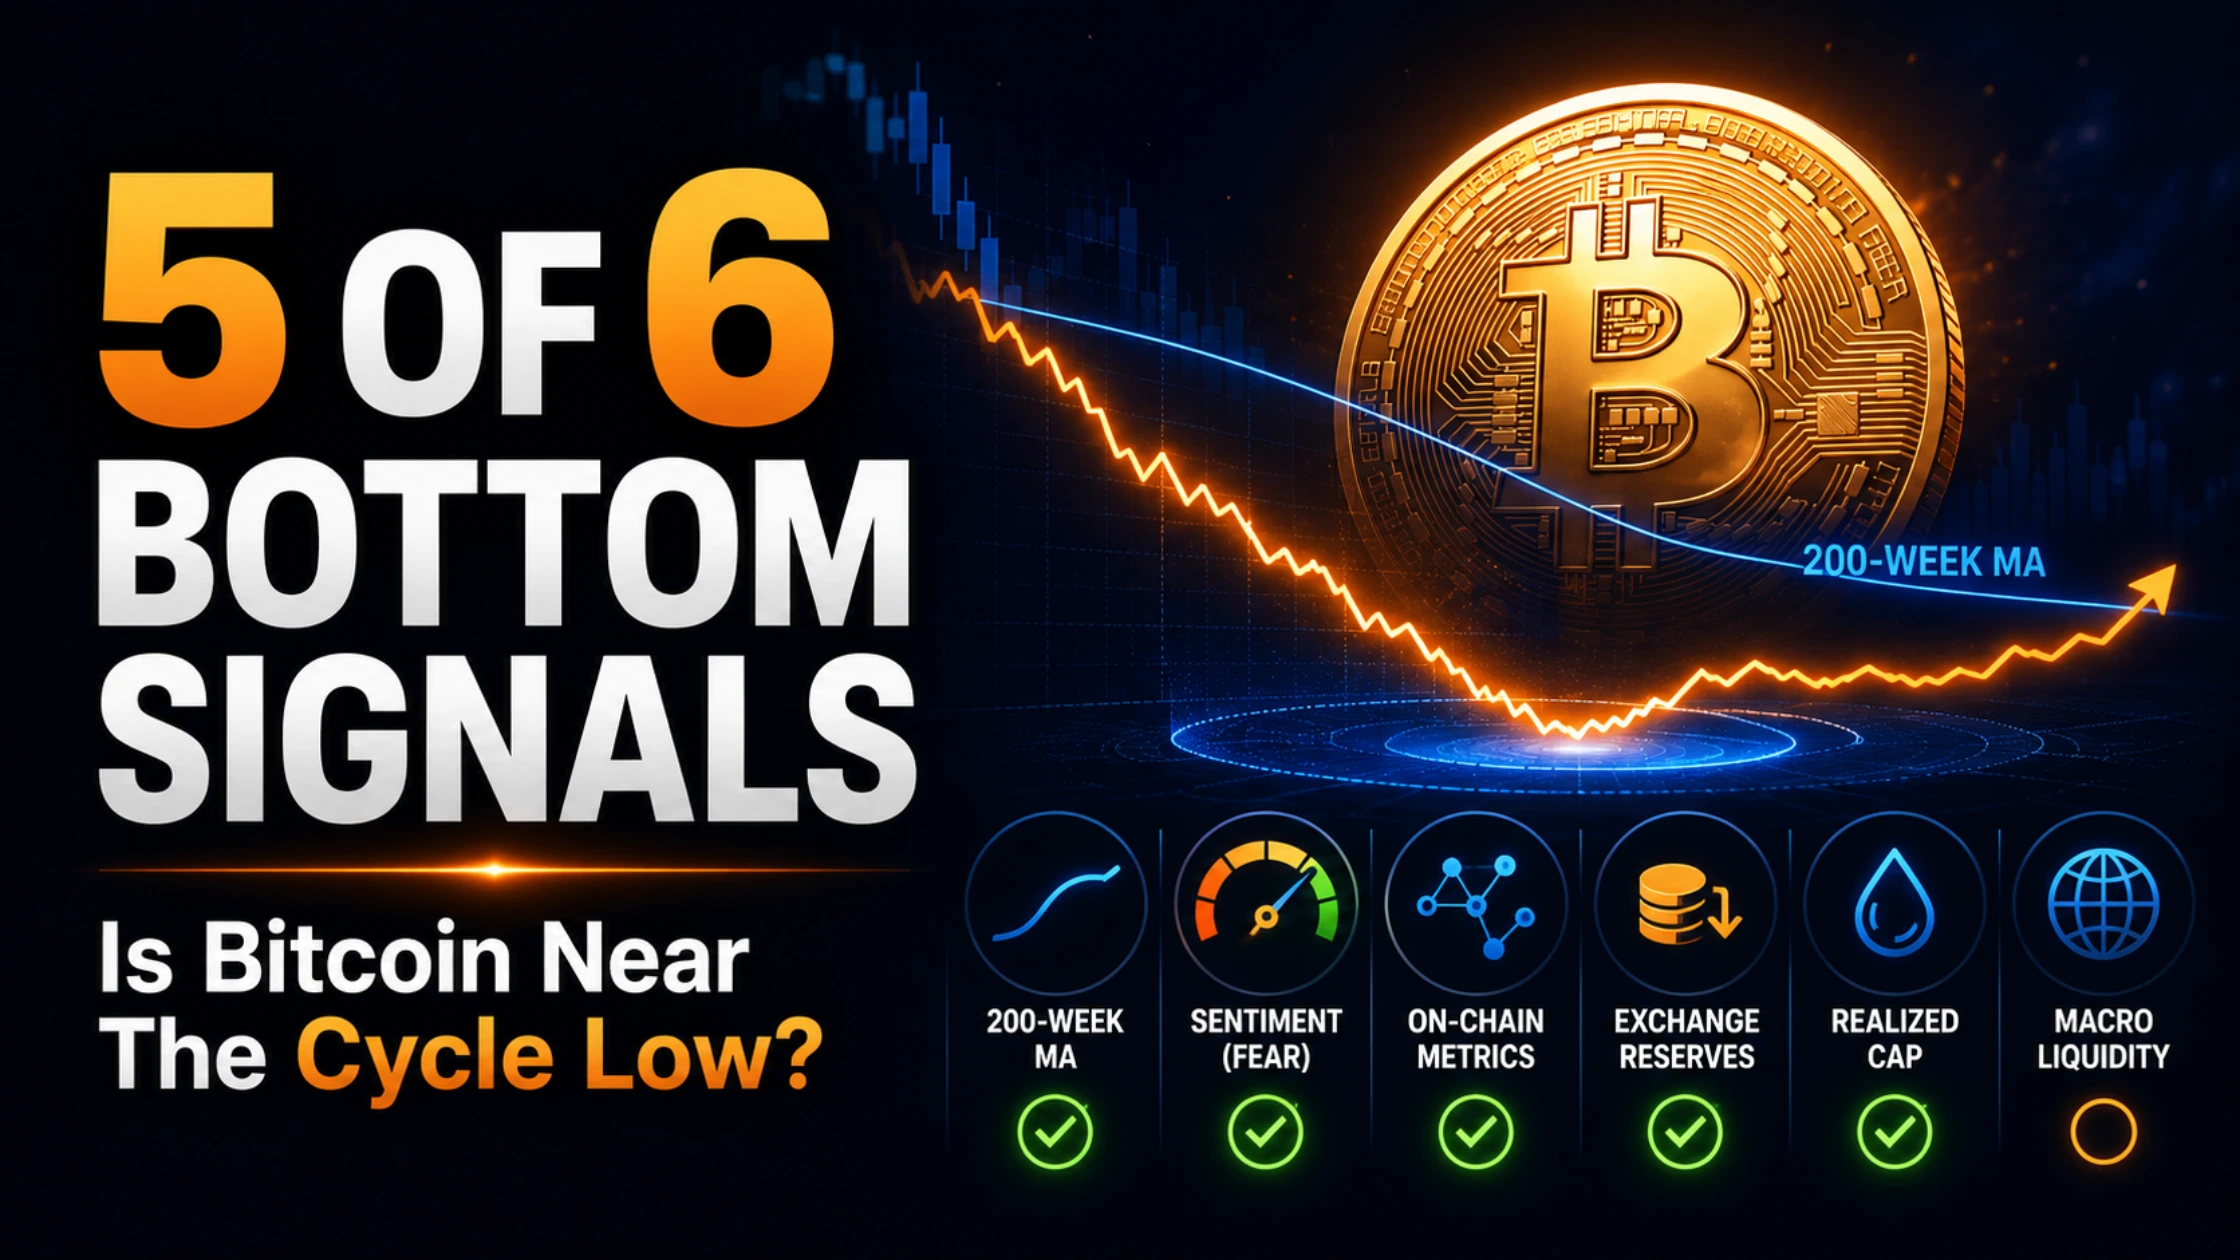
Five of the six conditions that marked every Bitcoin bottom in history are met right now. The sixth has never been missing before. We built an instrument that measures all six at once, live, and published the methodology.
Decentralised News · Updated June 12, 2026 · Original research · Reading time 15 min · Live tool included
Where is the crypto market in its cycle right now? The evidence says late-stage bear, not early-stage collapse. Bitcoin sits near $62,000, down 51 percent from its October 2025 peak, pressing against the 200-week moving average near $61,000. Nearly half of all Bitcoin supply is held at a loss, sentiment is at cycle lows, and leverage has been flushed. One thing present at every previous bottom is missing: an easing Federal Reserve. That single absence is the entire debate, and it is the reason on-chain analysts and macro analysts are currently reading the same market and reaching opposite conclusions.
So we built the instrument that holds both readings at once. The DN Cycle Entropy Index compresses six independent measurements, trend structure, on-chain cost basis, crowd psychology, holder cohort stress, derivatives positioning, and central bank policy, into one number between 0 and 100, where 100 is the full statistical signature of a cycle bottom. Today it reads 71: capitulation zone, liquidity-impaired. The live version is embedded below with every weight published and every input editable. This is a Receipts piece: every figure in this article is sourced, datestamped, and reproducible in the tool on this page.
What the popular theses get right, and where they break
This research began as an audit of the three theses dominating cycle commentary in June 2026: the supply-in-loss bottom thesis, the post-QT normalisation thesis, and the shallow-bear 200-week MA thesis. Stripped of presentation, each makes verifiable claims. We verified them.
Confirmed. The supply-in-loss pattern is real. CryptoQuant data shows roughly 9.09 million BTC, about 46 percent of circulating supply, held below its last on-chain transfer price, the second-highest loss concentration since the mid-2022 peak near 10 million coins. The association between peak loss-supply and cycle lows holds across 2011, 2015, 2018, 2020 and 2022. The 200-week MA thesis is also confirmed: Bitcoin tagged the line near $61,300 on June 4, 2026, the first touch this cycle, and every prior touch (December 2018 at 1.01x, March 2020, November 2022) marked a major low, with the one true breach (January 2015 at 0.89x) preceding a year of basing. The QT chronology checks out too: quantitative tightening ended December 1, 2025, and crypto's post-QT drawdown rhymes closely with the 2019 normalisation dip, when altcoins sat 70 to 91 percent down while the S&P 500 made new highs.
Wrong or stale. The most widely circulated macro framing fails verification badly. It claims the Fed is in a gradual cutting cycle and the backdrop is broadly supportive. The record says otherwise. The Fed cut three times in late 2025, then froze. The funds rate has sat at 3.50 to 3.75 percent through the January, March and April 2026 meetings, the March projections lifted the 2026 core inflation forecast to 2.7 percent, and after strong June jobs data the market-implied odds of a rate hike rose from roughly 40 to 57 percent. Kevin Warsh, confirmed 54-45 and installed as chair on May 15, 2026, runs his first FOMC meeting on June 16 and 17 into an Iran-war energy shock, oil between $93 and $100, and May CPI forecasts near 4 percent. J.P. Morgan now expects no cuts for the rest of 2026. That is not a supportive backdrop. It is the most hostile liquidity environment a 200-week MA test has ever faced, and any honest cycle model has to price it.
Misused. The entropy and chaos-theory framing circulating in commentary gestures at something real but executes it loosely: entropy is thermodynamics and information theory, not quantum physics, and bifurcation diagrams are illustrations, not evidence. We rebuilt the idea rigorously, because the underlying intuition, that capitulation is measurable as a disorder-maximisation process, is genuinely useful once you attach actual numbers to it.
The receipts: six gauges, one dissenter
| Gauge | Reading | Score | Bottom signature | Status |
|---|---|---|---|---|
| Trend valuation (price / 200W MA) | 1.02x | 81 | 0.89–1.05x | Met |
| Capitulation depth (supply in loss) | 46% | 82 | 50–60% | Near |
| Sentiment (Fear & Greed) | 8–12 | 88 | <15 | Met |
| Holder stress (STH MVRV) | 0.78 | 64 | <0.80 | Met |
| Leverage flush (OI from peak) | −53% | 76 | −50% or more | Met |
| Liquidity gate (Fed regime) | Restrictive hold | 25 | Easing | Missing |
Gauge 1: trend valuation, 81/100
The 200-week MA is Bitcoin's longest-running production-cost-adjacent trend line, and every macro bottom has formed at, just above, or briefly below it. As of June 12 the line sits near $60,800, rising at roughly $1,000 a month, while spot trades around $62,000, a ratio of about 1.02x. The December 2018 low printed at 1.01x. The structurally important nuance is convergence: because the 2024 to 2025 bull was the least explosive in Bitcoin's history, only a 50 percent drawdown was required to reach the line, versus 77 percent in 2022, 83 percent in 2018, and 87 percent in 2015. Diminishing bull amplitude mechanically produces diminishing bear depth; this is the strongest single argument for the shallow-bear case, and it is arithmetic, not narrative. It also means the remaining downside to a 2015-style 0.89x breach is roughly $54,000, which brackets the $50,000 to $55,000 zone that mining cost, realized price and MVRV band analyses independently flag as the deep-support cluster.
Gauge 2: capitulation depth, 82/100
The June 2026 supply-in-loss reading of roughly 46 percent is the second-deepest of the post-2020 era and within sight of the 50 to 60 percent band that marked the 2015, 2018 and 2022 lows. The mechanism is not mystical: loss-heavy supply means those still holding have demonstrated they will not sell at these prices, so marginal sell pressure migrates entirely to forced sellers. Liquidation data confirms the migration: roughly $6 billion in leveraged positions force-closed in the first ten days of June, and aggregate open interest collapsed from about $45 billion at the cycle high to roughly $21 billion. When selling is involuntary, it is finite.
Gauge 3: sentiment, 88/100
The Crypto Fear and Greed Index printed 8 on June 8, its cycle low, and has held between 8 and 12 for two weeks through relief bounces. Readings below 15 have historically clustered within weeks of major lows. The texture matters as much as the level: short-term holder realized losses are running at their highest rate since 2020 but arriving in waves rather than a single panic candle, what on-chain analysts are calling controlled capitulation. Strategy selling 32 BTC, its first sale since 2022, became a multi-day news cycle precisely because sentiment is brittle enough that $2.5 million of selling moved markets, and viral bankruptcy hit-pieces on the largest corporate holder are themselves a contrarian datapoint.
Gauge 4: holder cohort stress, 64/100
Short-term holder MVRV sits near 0.78, meaning the average coin bought in the last five months carries a 22 percent unrealized loss against a cohort cost basis near $87,000. Sub-0.80 readings are rare and have historically marked final-third bear territory or the bottom itself. The caveat that keeps this gauge below maximum is duration: October 2025 through March 2026 closed red, a six-month losing streak last seen in 2018, and grinding declines produce apathy bottoms rather than panic bottoms, and apathy bottoms take longer to resolve.
Gauge 5: leverage and flow structure, 76/100
The dollar that sets the marginal price changed owners this cycle, so the index treats flow structure as its own gauge. US spot Bitcoin ETFs recorded their largest outflow event since launch in early June, roughly $3.4 to $3.6 billion in a single week within a 13-session streak totaling $4.4 to $5.4 billion, BlackRock's IBIT leading. Bears read structural demand failure; the more precise reading, articulated by Standard Chartered, is institutional risk-budget reduction, since US equities fell to one-month lows the same week on identical catalysts. Here is the original insight most commentary misses: ETF-mediated ownership has changed the shape of capitulation itself. Retail panic produced deep, fast, emotionally exhausting bottoms; institutional de-risking produces shallower, longer, mechanically paced drawdowns that stop not when pain is maximised but when the risk model says correlation has normalised. The supply-in-loss chart will therefore cross its historic bottom thresholds at smaller drawdowns than past cycles, which is exactly what we observe. Combined with the open-interest halving, positioning is clean.
Gauge 6: the liquidity gate, 25/100
Here is the gauge that breaks from the other five, and it is the most important paragraph in this article. Every previous 200-week MA bottom formed with a central bank easing or about to ease: 2015 under ZIRP, 2018 to 2019 into the Powell pivot, 2020 under unlimited QE, 2022 to 2023 as the tightening cycle's end became visible. June 2026 is the first test of the line in Bitcoin's existence with a Fed on hold, internally divided, four dissents in April, the most since 1992, facing 4 percent-ish headline CPI from an energy shock, and led by a brand-new chair whose first meeting arrives in four days with markets pricing better-than-even odds that the next move is a hike. Global M2 still expands modestly, China continues stimulus, and the fiscal deficit guarantees long-run monetisation, so the multi-year tide remains in. But the 6-to-12-month liquidity impulse, the thing that timed every previous recovery off the line, is absent. The honest formulation: on-chain tells you where you are in the cycle; liquidity tells you when the next phase starts. Right now the map is bullish and the clock is broken.
Run the reading yourself
The instrument below pulls Bitcoin's spot price live from CoinGecko and the Fear and Greed Index live from alternative.me, combines them with datestamped on-chain inputs, each editable so the reading updates as new data prints, and recomputes the composite in real time against the fixed published weights.
Six gauges, one number. Price and sentiment fetch live; on-chain readings are BOARD values as of June 12, 2026, yours to update. The weights do not move, and neither does the honesty.
Educational model, not financial advice and not a prediction. Gauge formulas: trend = (1.75 − price/MA) / 0.90; capitulation = (loss% − 5) / 50; sentiment = 100 − F&G; holder stress = (1.10 − STH MVRV) / 0.50; leverage = OI decline / 70; liquidity = regime value; each clamped 0–100, weighted 20/20/15/15/15/15. BOARD inputs as of June 12, 2026; live price via CoinGecko, live sentiment via alternative.me, with board fallbacks if either fetch fails. Other publications may embed this tool with a followed credit link to the canonical page on decentralised.news.
What the conflict resolves into: three scenarios
Base case, 45 percent probability: time capitulation. The Fed holds through summer, the Iran energy shock proves transitory by Q4, and Bitcoin chops between $55,000 and $72,000 while the rising 200-week MA closes the gap from below at $1,000 a month. The bottom forms as a process, not an event, resolving when the first credible 2027 cut gets priced. This is the apathy-bottom path the six-month losing streak already implies, and it mirrors the 2015 basing year more than the 2018 or 2022 V-bottoms.
Bear case, 30 percent probability: the gate slams. Warsh validates the hike pricing or energy inflation forces his hand. The first genuinely hostile-Fed test of the 200WMA fails the way the 2015 test did, a 10 to 15 percent breach below the line, putting $50,000 to $54,000 in play, coinciding with the mining-cost and realized-price cluster. Critically, even this scenario is a deep-bear accumulation event by every on-chain precedent, not a structural failure; it would push the first five gauges above 90 and produce the cleanest maximum-entropy reading since November 2022.
Bull case, 25 percent probability: the gate opens early. Labour data cracks, energy retraces, Warsh, who has publicly argued AI is disinflationary, pivots dovish faster than a Powell Fed would have, and ETF flows mean-revert with the violence that 13-session outflow streaks have historically preceded. Reclaiming the $87,000 short-term holder cost basis flips the largest underwater cohort into profit and the reflexive loop runs upward. Targets cluster at $95,000 to $115,000 within two quarters.
Weighted across scenarios, the asymmetry favours staged accumulation in the $50,000 to $65,000 band over either all-in entry or abstention, with position sizing doing the work that prediction cannot. Fee drag compounds across dozens of staged entries, which is why we maintain a standing comparison in the DN Exchange Fee Optimizer and rank venues for recurring-buy efficiency in the DN Exchange Fit Engine. If you are accumulating on derivatives-capable venues, Bybit and OKX currently price spot recurring buys most competitively in our tracking, and anyone holding through a multi-quarter basing process should be holding keys, not IOUs, for which our standing pick remains a hardware wallet like Ledger, given that exchange failure is a named falsification input in this very model.
The altcoin overlay
The same entropy logic applies down the risk curve with higher amplitude. The ex-Bitcoin altcoin market cap is down roughly 43 percent from its high, against an 89 percent drawdown at the equivalent post-QT moment in December 2019, the same compression-of-amplitude effect visible in Bitcoin's gauges. Ethereum trades near $1,930 with a $233 billion market cap, down about 59 percent from peak, while ETH/BTC sits at levels where the prior cycle's ratio bottomed. The historically reliable tell is the copper-to-gold ratio and ISM PMI holding above 50: altcoin outperformance in 2020 began only when post-QT normalisation ended and the business cycle entered expansion together. One of those two conditions, QT over with 190-plus days elapsed, is met; the second, sustained PMI expansion with easing, is the same broken clock as Bitcoin's sixth gauge. Outliers like Hyperliquid and Zcash making highs against a bleeding market are normal late-bear behaviour, Chainlink did the same in 2019, and signal narrative rotation rather than the death of large caps. Our venue-by-venue positioning for the perp rotation, when it comes, lives in the DN Perp DEX Power Rankings.
What would change our mind
- A weekly close below $52,000. A 0.85x breach of the 200-week MA, deeper than 2015's, would invalidate the shallow-bear structure and shift the base case to a 2015-style year of basing at lower levels.
- Supply-in-loss exceeding 60 percent. Beyond every historical bottom band, that reading would imply structural rather than cyclical decline.
- Two or more actual rate hikes in 2026. One hawkish hold is a delayed clock; a hiking cycle is a different regime entirely, and the liquidity gauge would fall to 10.
- A top-five exchange or major treasury-company credit event. The Strategy preferred-dividend coverage runway, currently about seven months, is the named watch-item.
- ETF cumulative outflows exceeding 15 percent of assets under management without a flow reversal inside 90 days, which would falsify the risk-budget reading in favour of the structural-exit reading.
None of these conditions is currently met. All five are checkable against the tool above, which is the point of publishing falsification criteria alongside a thesis: an instrument you cannot prove wrong is not an instrument, it is a horoscope. The same discipline runs through the DN Cycle Position Clock and the DN Global Liquidity vs Bitcoin Tracker, the two companion instruments to this one.
The honest bottom line
The cycle question everyone asks has an on-chain answer, capitulation zone, five of six bottom conditions met, and a macro answer, the recovery clock has never started without easing and easing is not on offer, and the distance between those two answers is the most useful fact in crypto right now. It means the market exhibits most of the statistical anatomy of a major low while lacking the permission slip that converted every previous such anatomy into a recovery. It means a 71 is not a buy signal or a sell signal; it is a position report, and the position is late-bear with an unresolved dependency. And it means the only honest posture is the one the index enforces: respect what the chain is saying, price what the Fed is doing, size for the scenario you cannot predict, and let the sixth gauge, not your hope, tell you when the clock restarts. The instrument is above. It does not care what you hold. That is exactly what makes it useful.
Frequently asked questions
A proprietary 0-to-100 composite published by Decentralised News that measures how closely current conditions match the statistical signature of a crypto cycle bottom, combining six gauges: price versus the 200-week moving average, supply held at a loss, sentiment, short-term holder MVRV, derivatives positioning, and the central bank liquidity regime, with fixed published weights. Readings above 66 indicate capitulation-zone conditions.
The index reads 71/100: capitulation zone, liquidity-impaired. Five of six bottom conditions are met, with Bitcoin at its 200-week moving average, 46 percent of supply in loss, extreme-fear sentiment, and leverage flushed. The missing condition is an easing Federal Reserve, making this the first 200-week MA test in Bitcoin's history under restrictive monetary policy.
Unknowable in real time, but the evidence weighs toward a bottoming process rather than a completed bottom. The base case, 45 percent probability in our model, is sideways time capitulation between $55,000 and $72,000 while the rising 200-week MA converges with price. A weekly close below $52,000 would invalidate the shallow-bear thesis.
Arithmetic, primarily. Each prior bear's depth, 90, 87, 83 and 77 percent, was the drawdown required to return price to the 200-week moving average after explosive bull runs. The 2024 to 2025 bull was the least explosive in Bitcoin's history, so only about 50 percent was required. Institutional ETF ownership also paces selling mechanically rather than emotionally, producing shallower, longer drawdowns.
It measures the share of all Bitcoin held below its last on-chain transfer price. At roughly 46 percent, about 9.09 million BTC, it is at its second-highest level since mid-2022. Peaks in supply-in-loss have coincided with cycle bottoms in 2011, 2015, 2018, 2020 and 2022, because once maximum pain is reached, voluntary sellers are exhausted and only forced selling remains.
Decisively. Rates are held at 3.50 to 3.75 percent, the market prices meaningful hike risk after hot jobs and inflation data, and Warsh's first FOMC meeting on June 16 to 17, 2026 sets the tone. Every previous Bitcoin cycle bottom formed alongside an easing Fed; a hawkish Warsh delays the recovery clock even with bottom-like on-chain conditions, while a dovish surprise would complete the index's sixth gauge.
The evidence says no. The roughly $3.4 to $5.4 billion outflow streak in early June 2026 coincided with equities falling on identical macro catalysts, consistent with mechanical institutional risk-budget cuts rather than abandonment, a reading shared by Standard Chartered. Extended outflow streaks have historically clustered near local bottoms, and flows mean-revert violently when they reverse.
Four things together: ETF flows turning and staying positive for two-plus weeks, Bitcoin reclaiming the short-term holder cost basis near $87,000, supply-in-loss rolling over from its peak, and rate-cut probabilities for 2026 or early 2027 rising. A composite reading falling back below 60 on rising prices is the historical recovery signature.
Altcoins carry higher amplitude in both directions. The ex-BTC market cap is down 43 percent versus 89 percent at the equivalent moment last cycle, and history shows altcoin outperformance begins only when post-QT normalisation ends and the business cycle expands with easing liquidity. That second condition is not yet met, which argues for Bitcoin-first positioning until the liquidity gate opens. Not financial advice.
Yes. Publishers are granted a standing licence to embed the tool with attribution via a followed link to the canonical page on decentralised.news. The instrument is self-contained HTML and runs in any CMS that accepts raw HTML.
Decentralised News publishes research, not financial advice. The DN Cycle Entropy Index is a model output under stated assumptions, not a prediction of any outcome; the gauge formulas, weights and BOARD inputs are published above and open to challenge. Data cited: CoinGecko, CryptoQuant, Glassnode-derived summaries via CoinDesk, alternative.me, CoinShares fund-flow reports and Federal Reserve communications, as of June 12, 2026. Crypto assets are volatile and can lose all value. Some links are referral links that support our free tools at no cost to you. The wider instrument suite is documented alongside the editor's books Blockchain Applied and Tokenized Trillions, and the methodology is open to challenge via the contact page.


