
Decentralised News Research · Quant Validation 2027
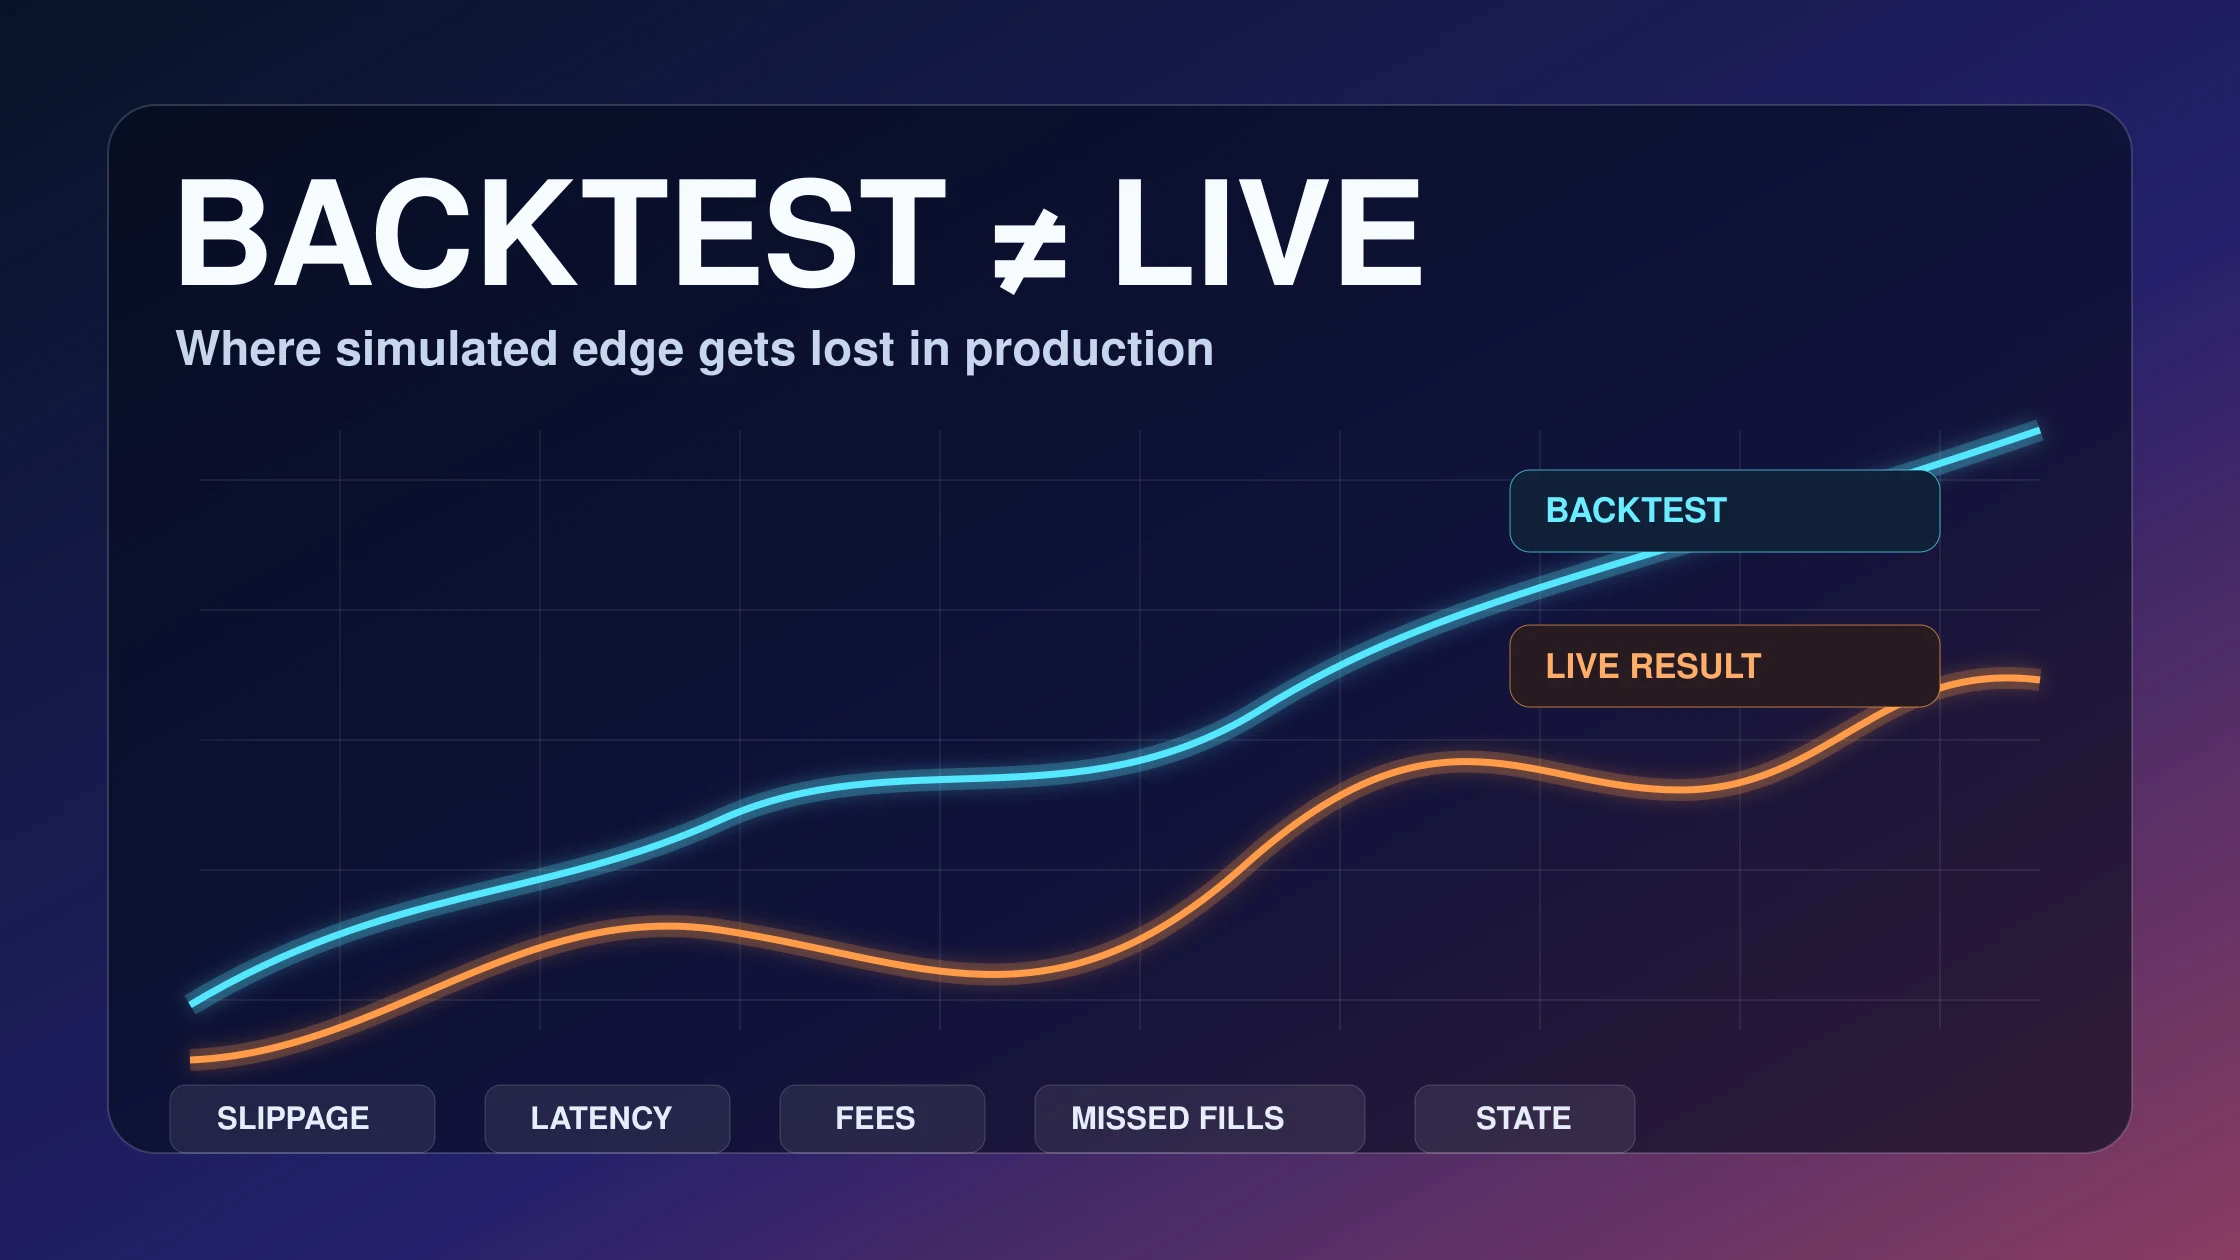
A profitable backtest can fail live even when the strategy idea is sound. The gap usually comes from future information leaking into the test, overfitting, unrealistic fills, unmodelled execution costs or production behaviour that differs from historical simulation. The DN Backtest-to-Live Gap framework turns those failure modes into a deployment checklist and reconciliation process.
DN Evidence Block
- Last verified
- 1 November 2026.
- Primary evidence
- Current Freqtrade, QuantConnect/LEAN, OKX, Bybit and Coinrule documentation, plus published backtest-overfitting research.
- Scope
- Crypto systematic trading, trading bots and exchange-connected strategies moving from historical simulation toward live execution.
- Decisive finding
- Backtest/live divergence can arise before execution, during execution and after deployment; one equity curve cannot identify which layer failed.
- Original DN work
- DN Backtest-to-Live Gap Map, Reconciliation Loss formula, Deployment Ladder and interactive Backtest Credibility Diagnostic.
- Observed testing status
- No matched DN live-versus-backtest trade dataset is claimed in this edition.
- Author
- Decentralised News Research.
- Limit
- This is a validation framework, not a prediction of future profitability.
The DN Backtest-to-Live Gap
DN defines the Backtest-to-Live Gap as the difference between what a strategy appears able to earn in historical simulation and what the same locked strategy can actually realise after live data, exchange rules, latency, fills and operational state are applied.
1. Look-Ahead Bias Can Manufacture Profit
Freqtrade’s current documentation warns that backtesting loads the full dataframe, so strategy code can accidentally access future candles that would not exist in dry or live mode. Its lookahead-analysis command compares baseline and sliced backtests to detect indicator or signal changes that reveal this leakage.
The failure mode is simple: a strategy using a negative shift, a future row or a full-series aggregation can appear to predict price when it is actually reading later information.
2. Recursive Indicators Can Change When Live History Is Shorter
In a historical test, an indicator may be calculated with thousands of prior candles. In live deployment, the exchange or bot may start with a much shorter history window. Freqtrade’s recursive-analysis documentation checks whether different startup candle counts materially change the latest indicator value. This matters for recursive indicators such as EMAs, where different warm-up histories can create different trading signals even when the code is otherwise identical.
3. Backtest Fills Are Usually Cleaner Than Live Fills
Freqtrade’s published assumptions state that, under its default model, orders inside the candle’s high/low range are assumed filled and no slippage is applied. Its strategy guide recommends dry-run forward testing because limit orders may not fill in real-time conditions and signal-to-order processing introduces delay.
QuantConnect makes the same distinction in another implementation. Its current reconciliation documentation notes that live brokerage fills can differ from backtest fills, market impact is not modelled by default, and live limit orders may partially fill or fail even when a simulated order would have filled.
4. Latency Turns a Signal Into a Different Trade
A live system must receive the market event, update local state, calculate the signal, pass risk checks, transmit the order, reach the exchange gateway and enter the matching-engine queue before a fill is possible.
Freqtrade warns that dry-run entries can occur seconds after candle open because pair dataframes still need to be processed. QuantConnect similarly documents different event and fill timing between historical and live modes.
The important variable is therefore not only signal accuracy. It is signal half-life: how much of the expected edge survives the time it takes to act.
5. Parameter Search Can Turn Noise Into a Strategy
Bailey, Borwein, López de Prado and Zhu formalised the probability of backtest overfitting for investment simulations. Their central point is straightforward: the more configurations researchers try, the easier it becomes to find an impressive historical result by chance.
Bailey and López de Prado’s Deflated Sharpe Ratio addresses related performance inflation from multiple testing and non-normal returns.
DN Backtest Credibility Score
This is not a profit score. It measures whether the testing process has removed common reasons for a strategy to look better historically than it can perform live.
| Validation Layer | Weight | Evidence Needed | Failure It Addresses |
|---|---|---|---|
| Data integrity & bias control | 20% | Look-ahead checks, recursive checks, timestamp/source validation | Future leakage and indicator drift |
| Overfit control | 20% | Locked rules, disclosed trial count, out-of-sample or walk-forward period | Parameter mining and selection bias |
| Execution realism | 25% | Spread, slippage, partial fills, latency, queue/impact assumptions | Impossible or overly clean fills |
| Forward validation | 20% | Dry-run/paper test on live data with frozen parameters | Data timing and operational differences |
| Micro-live reconciliation | 15% | Small live orders matched against modelled fills and fees | True production execution gap |
The DN Reconciliation Loss
Once the strategy reaches micro-live trading, the gap can be measured per order rather than argued about abstractly.
reconciliation_loss_bps =
    signal_delay_bps
  + spread_difference_bps
  + slippage_difference_bps
  + fee_difference_bps
  + partial_fill_loss_bps
  + market_impact_bps
  + missed_trade_loss_bps
  + operational_error_bps
Backtest Assumptions That Should Be Written Down
| Assumption | Backtest Question | Live Question |
|---|---|---|
| Trade timestamp | When does the strategy see the event? | When did the production process actually receive it? |
| Entry price | Open, close, mid, bid/ask or custom model? | What price was actually executable after latency? |
| Order fill | Immediate, complete or depth-constrained? | Was it partial, queued, rejected or missed? |
| Fees | Maker/taker tier assumed? | What did the account actually pay? |
| Slippage | Fixed bps, volatility model or none? | What did realised fills show? |
| Market impact | Modelled? | Did order size move the execution price? |
| Universe | Were delisted or unavailable assets included? | Could the strategy actually trade the same set? |
| Funding / borrow | Included? | What was actually charged? |
| Restart state | Perfect continuity assumed? | Can state be rebuilt after process failure? |
| Exchange rules | Tick, step and minimum size enforced? | Did production reject or round the order? |
Forward Testing Is Not the Same as Backtesting
Freqtrade calls dry run forward testing because it consumes real-time exchange data while keeping trades simulated. It describes forward testing as a more reliable indicator of potential performance than historical backtesting, while still noting that it cannot reproduce every production fill.
Exchange Demo Environments Help — But Do Not Close the Gap
Exchange and bot demo environments remain useful for API and order-state testing, but they do not reproduce every production condition. Bybit explicitly says its demo service has fewer functions than real trading, while Coinrule documents that its demo environment does not model slippage and can diverge from live results on less-liquid assets. These are validation environments, not proof of production execution quality.
A sandbox can validate signatures, payload structure, private state, reconnect logic and balance/position workflows. It cannot by itself validate production queue position, real market impact, stress-event latency, actual fill probability or live slippage at meaningful size.
The DN 7-Stage Backtest-to-Live Deployment Ladder
| Stage | Environment | Capital Risk | What Must Pass |
|---|---|---|---|
| 1 | Unit / logic tests | None | Signals, sizing and accounting behave as specified. |
| 2 | Historical backtest | None | Strategy survives multiple regimes after realistic costs. |
| 3 | Bias & overfit tests | None | No look-ahead; acceptable recursive stability; parameters locked. |
| 4 | Out-of-sample / walk-forward | None | Performance does not collapse on untouched data. |
| 5 | Live-data dry/paper test | None | Signal timing and state remain consistent with the locked strategy. |
| 6 | Micro-live | Minimal | Measured fills, fees, slippage and latency are within the model. |
| 7 | Controlled production | Defined | Risk limits and reconciliation remain stable as size increases. |
DN Backtest Credibility Diagnostic
Score the Validation Process — Not the Strategy Return
What a Matched DN Live Test Should Record
strategy_id · methodology_version · exchange · symbol · order_type · signal_time_utc · decision_time_utc · client_send_time_utc · exchange_ack_time_utc · requested_price · requested_quantity · backtest_fill_price · live_fill_price · live_fill_quantity · fee_asset · fee_amount · spread_bps · slippage_bps · market_impact_bps · partial_fill_flag · cancel_confirm_ms · reconnect_flag · model_expected_edge_bps · live_realised_edge_bps · reconciliation_loss_bps · evidence_class
DN Alpha Thesis: The Gap Is More Valuable Than the Backtest
A clean live reconciliation series can be more useful than a spectacular historical equity curve because it tells the trader which assumptions survive production. If live degradation is stable, the model may be repairable. If degradation is unstable — fills disappear in volatility, state diverges after reconnects, or edge vanishes outside the training regime — the historical strategy may not represent a production system at all.
What Would Change This Framework?
- A major backtesting engine materially changes its default fill, slippage or market-impact model.
- Exchange sandbox environments become demonstrably production-equivalent for fills and queue behaviour.
- New research materially improves multiple-testing or overfit detection methods.
- DN completes a matched live-vs-backtest dataset large enough to replace documented risk categories with observed distributions.
- Exchange APIs materially change timestamping, acknowledgements, rate limits or simulated-trading behaviour.
Methodology & Limitations
DN reviewed current first-party documentation from Freqtrade, QuantConnect/LEAN, OKX, Bybit and Coinrule together with established published research on backtest overfitting. The framework is platform-agnostic: it evaluates the research and deployment process rather than promoting one exchange, bot or backtester.
The DN Backtest Credibility Score is a transparent validation-readiness model. It does not estimate expected return and does not convert a weak strategy into a strong one. No DN matched live-vs-backtest execution dataset is claimed in this edition.
Evidence Classification
| Class | Meaning |
|---|---|
| Primary documented | Behaviour stated in current official software or exchange documentation. |
| Published research | Statistical or methodological claims supported by cited academic/professional research. |
| Modelled | DN framework, score or formula derived from explicit assumptions. |
| Observed | Direct matched DN live-vs-backtest testing. Not claimed in this edition. |
Related DN Research
FAQ
Why do profitable backtests fail live?
Common reasons include look-ahead bias, overfitting, unrealistic fill assumptions, omitted transaction costs, latency, partial fills, market impact, state-recovery failures and regime changes.
Is paper trading enough after a backtest?
No. It is useful forward validation with live data, but simulated fills may still differ from production. Micro-live trading with strict risk limits is the first stage that measures real execution.
What is look-ahead bias?
It occurs when a historical strategy uses information that would not have been available at the decision time.
How much live capital should be used for validation?
Only the minimum amount needed to obtain meaningful execution evidence under hard loss and exposure limits.
Does a high Sharpe ratio prove a backtest is robust?
No. Multiple testing, non-normal returns and parameter selection can inflate reported Sharpe ratios.
Primary Research Sources
- Freqtrade — Lookahead Analysis
- Freqtrade — Recursive Analysis
- Freqtrade — Strategy Quickstart
- Freqtrade — Backtesting
- QuantConnect — Live Reconciliation
- QuantConnect — Reality Modeling
- QuantConnect — Trade Fills
- OKX API V5
- Bybit — Demo Trading Service
- Coinrule — Comparing Live Trading & Demo Exchange
- Bailey, Borwein, López de Prado & Zhu — The Probability of Backtest Overfitting
- Bailey & López de Prado — The Deflated Sharpe Ratio
Change Log & Corrections
1 November 2026: First DN-BTLG v1.0 edition. Added the Backtest-to-Live Gap Map, Backtest Credibility Score, Reconciliation Loss framework, deployment ladder and interactive diagnostic.
Corrections: Decentralised News contact page.
Test the deployment path before scaling capital
For traders who want a commercial environment that supports historical testing and paper trading before live deployment, Coinrule currently documents both workflows. Treat any platform’s backtest or paper result as one validation stage, not as evidence that live fills, slippage or profitability will match. Verify current exchange support, pricing and API permissions before connecting capital.
Final Takeaway
Risk disclosure: Automated trading can lose money rapidly. Backtests, paper trading and micro-live tests do not guarantee future returns. Exchange APIs, fees, market conditions and execution quality can change. This material is educational and is not financial or investment advice.