
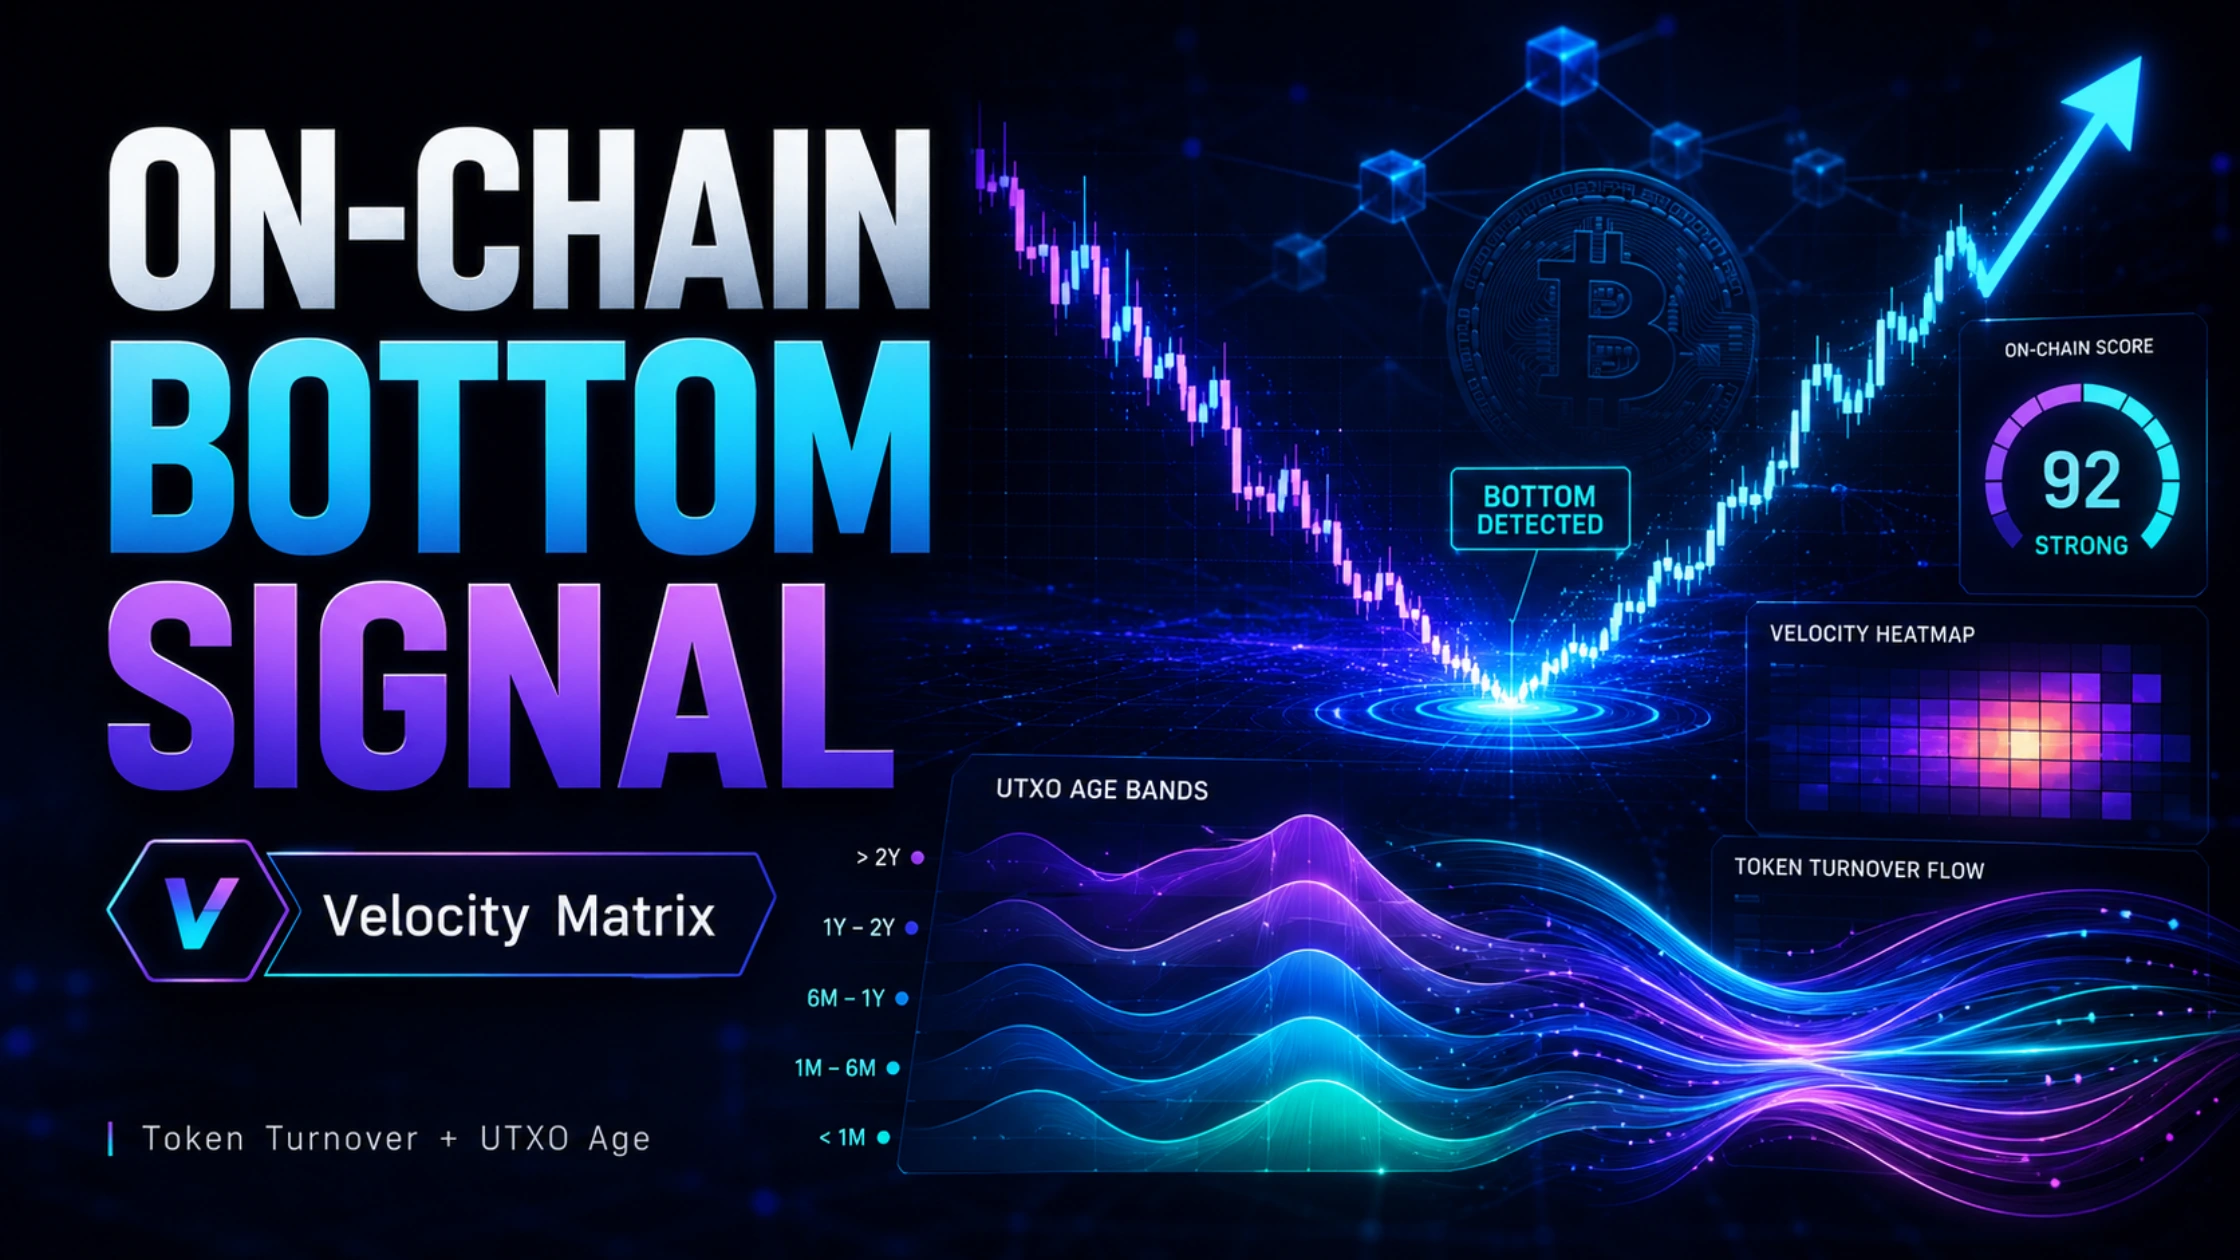
The On-Chain Velocity Matrix: Using Token Turnover and UTXO Age to Predict Local Bottoms
While traditional stock investors must wait for delayed quarterly earnings reports, cryptocurrency asset managers operate with an unprecedented analytical advantage: Full On-Chain Transparency. Every Satoshi and Gwei transferred across decentralized ledgers leaves a permanent, time-stamped paper trail of capital movement, cost basis shifts, and holder conviction.
Retail participants frequently panic-sell during sharp market drawdowns because they evaluate price action through lagging technical indicators like moving averages or RSI. Institutional quant desks, however, look underneath the price tape to analyze **Unspent Transaction Output (UTXO) Age Bands** and **Token Velocity**. By measuring when dormant long-term supply wakes up versus when short-term speculative capital capitulates, institutional traders spot generational accumulation floors long before technical trend reversals appear on public charts.
1. Deconstructing UTXO Realized Price and HODL Waves
Unlike centralized order books that show intention, UTXO age distributions track **settled capital behavior**. Every output on the blockchain carries two prices: the price when it was created (Realized Price) and the current market price.
To identify macro market bottoms, quantitative analysts combine **Market Value to Realized Value (MVRV)** ratios with age-band velocity metrics. Realized Value calculates the aggregate cost basis of all circulating coins based on when each coin last moved on-chain.
The Equation of Realized Market Capitalization
$$\text{Realized Cap} = \sum_{i=1}^{N} \text{UTXO}_i \cdot P_{\text{creation}, i}$$
$$\text{MVRV Ratio} = \frac{\text{Market Capitalization}}{\text{Realized Capitalization}}$$
When the MVRV ratio compresses toward or below $1.0$, the market trades at or beneath the network's aggregate cost basis. Historically, MVRV readings under $1.0$ signal extreme seller exhaustion where smart-money entities absorb capitulating supply from retail participants.
2. Interactive UTXO Realized Price & HODL Wave Simulator
Use our quantitative on-chain simulator below to model market bottom signals. Test varying spot prices, long-term HODL wave proportions, short-term turnover rates, and aggregate realized cost baselines to calculate real-time MVRV Z-Scores and bottom probabilities.
3. The On-Chain Execution Blueprint
Capitalizing on on-chain bottom signals requires coordinating on-chain analytics platforms with deep-liquidity spot execution venues. Follow this 4-step framework:
Set up automated tracking charts monitoring MVRV Z-scores and 6-month+ HODL wave bands using professional analytics terminals such as TradingView or Coinigy. Watch for MVRV dips toward $1.00 combined with rising illiquid supply.
When short-term holders dump coins below realized cost, execute spot accumulation on deep-liquidity global venues. Deploy capital via Bybit (Code: 46164), OKX (Code: 2136301), Binance (Code: CPA_00SXKU7IO9), or Kraken (Code: QjZ0L3).
Route accumulated assets across multi-chain ecosystems using zero-slippage liquidity bridges like deBridge. For instant, non-custodial asset swaps without account registration, use SideShift or ChangeNOW.
Once spot accumulation fills, withdraw assets from centralized platforms into cold storage. Isolate private keys using air-gapped hardware security architecture provided by Ledger or OneKey (Code: 46Z9TD) to enforce self-custody.
4. On-Chain Analytics & Quantitative Tooling Stack
To monitor real-time UTXO age bands, entity-adjusted volume clusters, and tax-optimized accounting, integrate these professional quantitative software platforms into your trading stack:
- On-Chain Portfolio Tracking & Tax Compliance: Monitor multi-wallet UTXO movements and realized cost baselines using CoinStats or Koinly.
- Cross-Exchange Arbitrage & Flow Scanners: Scan live exchange pricing discrepancies during high-velocity on-chain movements with ArbitrageScanner or ASCN AI.
- Automated Execution & Rebalancing Bots: Program automated rebalancing triggers when on-chain indicators cross key thresholds via Coinrule, Cryptohopper, or 3Commas.





