
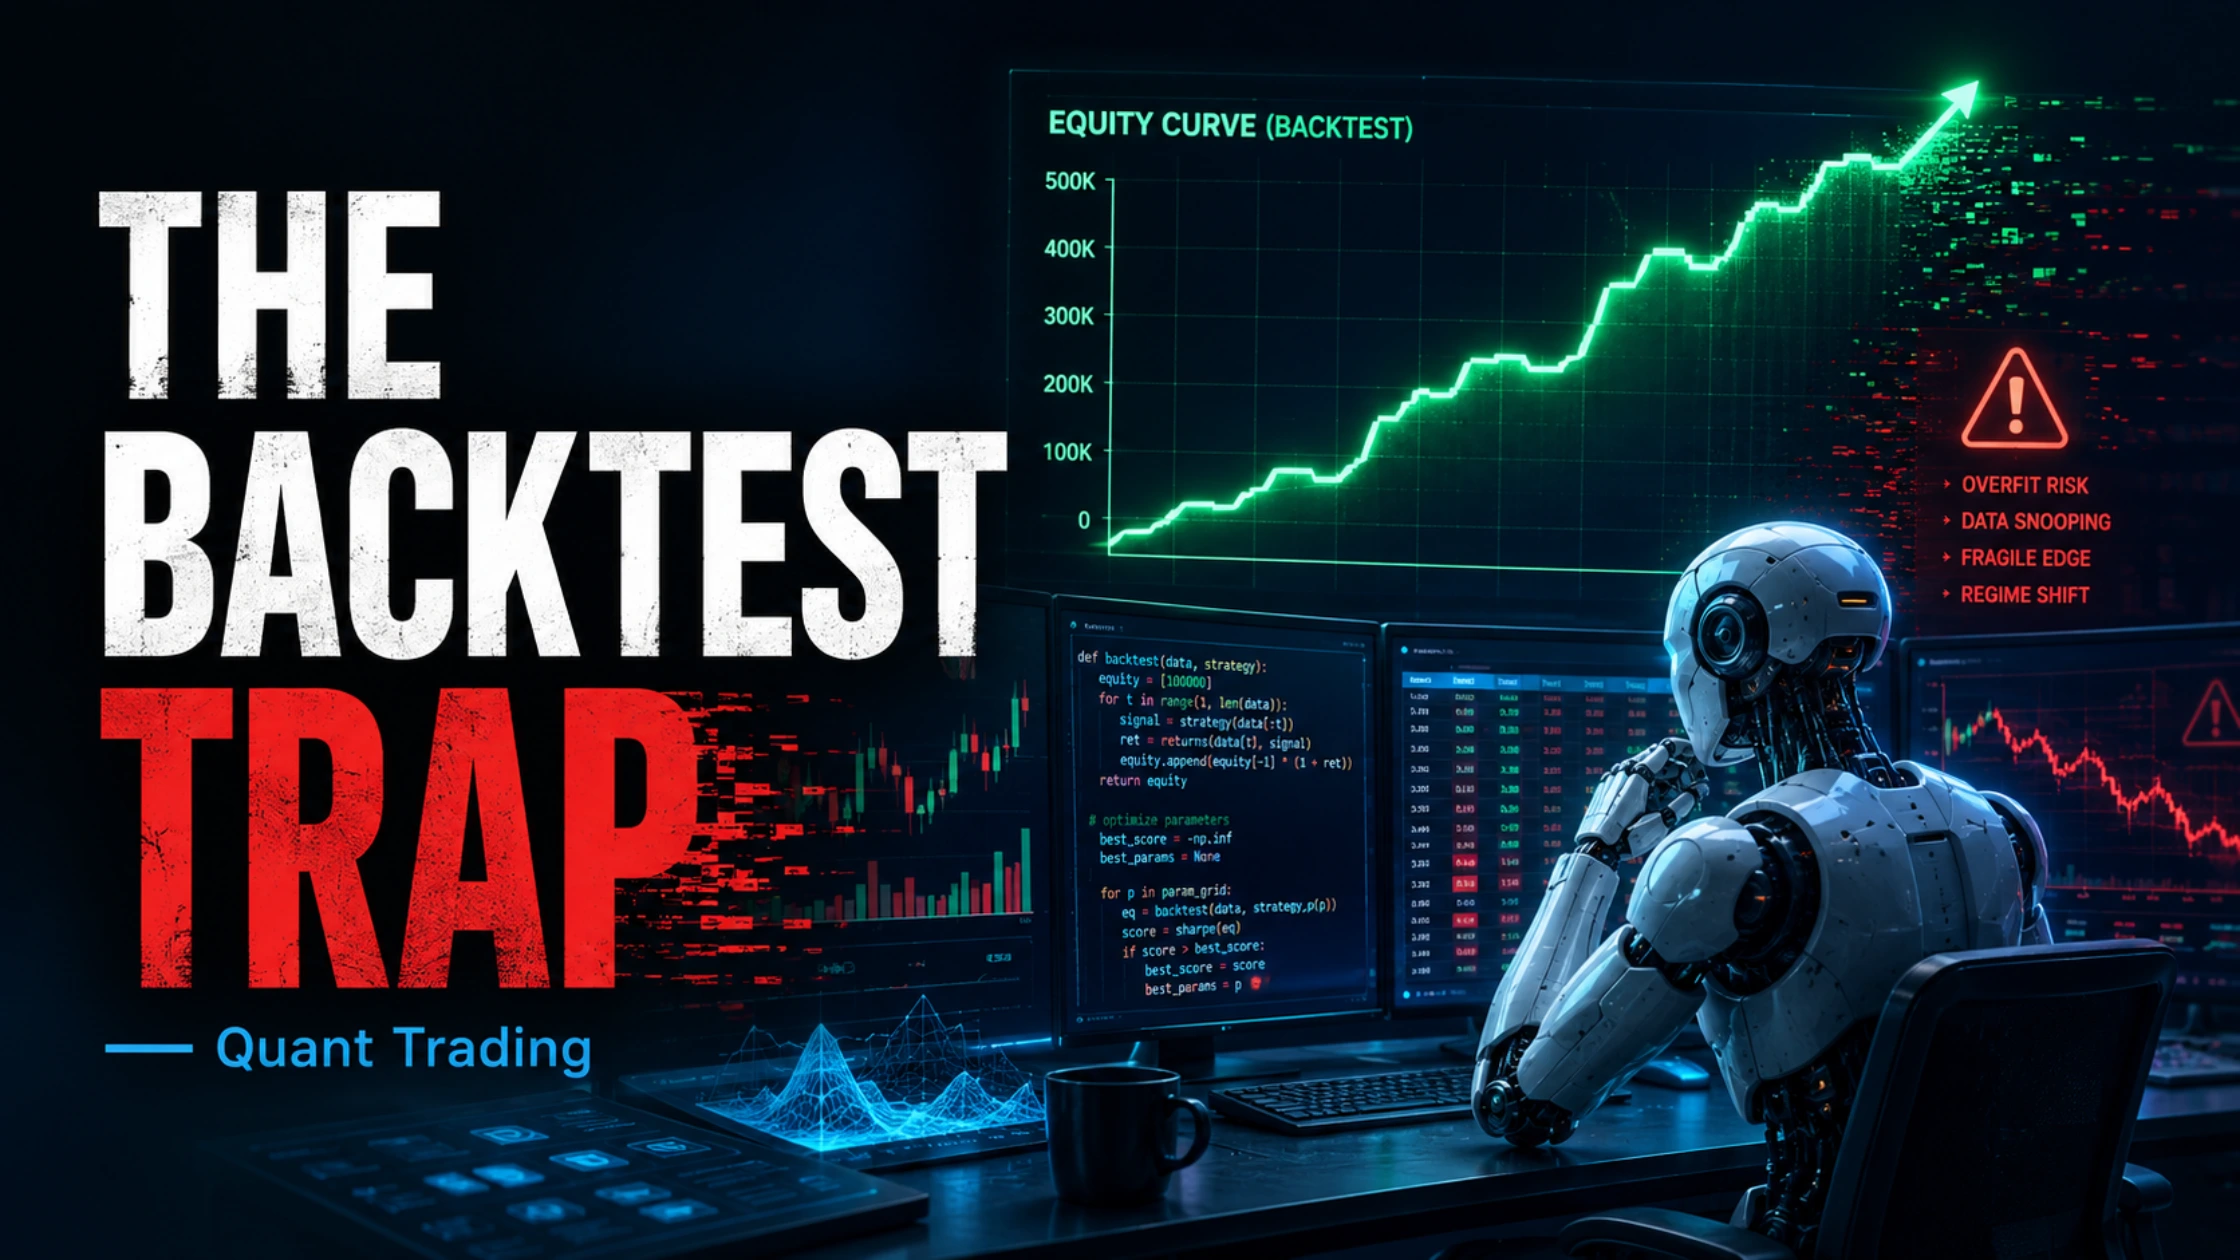
The machines that beat the market: quant trading's greatest edges, its unique failures, and the number that separates skill from a lucky backtest, 2026 edition
- Quant trading replaced narrative and conviction with statistical and computational edge, from Ed Thorp's 1960s probability-based blackjack and options models to Jim Simons's Renaissance Technologies, whose Medallion Fund averaged roughly 66 percent annual returns before fees across three decades.
- Quant strategies fail differently from conviction-driven ones: not by being wrong about the world, but by every fund crowding into the same statistically-discovered signal at once, or by the execution infrastructure itself breaking in ways no backtest modeled.
- The August 2007 "Quant Quake" saw multiple unrelated, similarly-constructed quantitative equity funds forced to deleverage simultaneously; Goldman Sachs's flagship quant fund Global Alpha, which peaked near $12 billion, lost 22.7 percent in August 2007 alone and was wound down by 2011.
- On August 1, 2012, a single reactivated piece of dormant test code caused Knight Capital's automated systems to accumulate more than $7 billion in unintended positions across 154 stocks in 45 minutes, costing the firm $440 million and forcing its sale within a year.
- A 2014 academic breakthrough, the Deflated Sharpe Ratio developed by David Bailey and Marcos Lopez de Prado, provides a mathematical correction for exactly the failure mode most retail and even institutional backtests never disclose: how many strategy variations were tried before the one that looked good was selected.
- The DN Deflated Sharpe Ratio Calculator, embedded below, applies that correction directly: enter a backtested Sharpe ratio, how many variations were tested, and the track record length, to see the statistically adjusted probability the edge is real.
DN Deflated Sharpe Ratio Calculator
A backtested Sharpe ratio is not a fact. It is a fact conditioned on how many strategies you tried to find it.
The investors covered in DN's previous framework piece won by being right about something, a currency, a company, an economic regime, and sizing a position to match that conviction. Quant trading is a different discipline built on a different, almost opposite premise: that individual conviction about the world is a liability, and that a repeatable statistical edge, found in data and executed at a speed and scale no discretionary trader can match, is more durable than any single person's judgment. That premise built the best risk-adjusted track record in financial history. It also produced a distinct category of catastrophic failure that has nothing to do with being wrong about a market and everything to do with either crowding or code.
The origin: counting cards, then counting options
Ed Thorp is the clearest starting point because his career demonstrates the underlying logic in its purest form. A mathematics professor, Thorp used probability theory to develop a card-counting system that gave blackjack players a genuine, quantifiable edge against the house, publishing the results in Beat the Dealer in 1962. He then applied the identical instinct, find the mathematical mispricing, size the bet to the edge, repeat, to financial markets, developing quantitative approaches to option pricing years before the Black-Scholes-Merton formula was published in 1973, and running the market-neutral Princeton Newport Partners for roughly two decades without a losing year. Thorp's insight was not a market view. It was a method: markets, like casino games, contain small, exploitable mathematical edges that hold regardless of anyone's opinion about where prices are headed next.
The pattern that started it all on a Morgan Stanley trading floor
Statistical arbitrage, the strategy underlying most of what followed, traces to a specific place and a specific insight: Morgan Stanley's Automated Proprietary Trading group in the early 1980s, where quantitative analyst Gerald Bamberger and later Nunzio Tartaglia's team discovered that pairs of historically correlated stocks, when their prices temporarily diverged, tended to converge again, a mean-reversion pattern that could be traded systematically and market-neutrally, long the underperformer, short the outperformer, with no directional market view required at all. That single insight, mechanized and scaled, seeded an entire generation of quant funds and traders, including Peter Muller, who built Morgan Stanley's Process Driven Trading desk into one of the most consistently profitable units on Wall Street through the 1990s and 2000s using a descendant of the same statistical arbitrage logic.
The apex: Jim Simons and the machine nobody could reverse-engineer
Jim Simons took the statistical edge premise further than anyone. A mathematician, Cold War codebreaker and former chair of Stony Brook University's math department, Simons founded what became Renaissance Technologies in 1978, eventually building the Medallion Fund into the best-documented risk-adjusted track record in financial history, averaging close to 66 percent annual returns before fees across roughly three decades, achieved by systematically identifying small, statistically persistent patterns across enormous datasets that no individual trader could see or explain in narrative terms. Renaissance famously closed Medallion to outside investors in the early 1990s and has run it almost entirely on employee capital ever since, itself a quiet acknowledgment of one of quant investing's least discussed constraints: a strategy that depends on exploiting small, fleeting statistical edges has a capacity limit, and deploying more capital into it degrades the very returns that made it attractive. Simons died in May 2024; Renaissance, now led by CEO Peter Brown, continued running its institutional funds with roughly $64 billion in assets as of early 2026, evidence that the statistical process, not any individual's ongoing judgment, was always the actual asset being managed.
Cliff Asness took a related but distinct path: after co-founding Goldman Sachs's Global Alpha fund in 1997 using systematic, factor-based models built on academic research into value and momentum, he left in 1998 to found AQR Capital Management, which productized the same style of factor investing, quantifiable, historically-tested drivers of return like value, momentum and quality, into a repeatable process explicitly designed to be understood and explained rather than kept as a black box. David Shaw built D.E. Shaw & Co. on comparable computational foundations starting in 1988, and firms including Two Sigma, founded by John Overdeck and David Siegel in 2001, and modern market-making specialists like Jane Street and Citadel Securities, extended the same statistical, technology-first approach into new domains, from equities and futures to options market-making and, more recently, crypto liquidity provision.
The failure mode unique to this discipline: everyone finding the same signal at once
Quant strategies do not typically fail because the underlying statistical relationship stops existing. They fail because enough other funds discover and lean on the same relationship that unwinding it becomes its own market event, entirely disconnected from whether the original signal was ever wrong. That is exactly what happened during the week of August 6, 2007, an episode now known across the industry as the Quant Quake. Academic research into the event, notably by Amir Khandani and Andrew Lo at MIT, found that a large, statistically similar equity market-neutral portfolio, or several, was forced into rapid liquidation, likely for reasons unrelated to those specific positions' merit, and that because so many quantitative long-short funds ran overlapping factor exposures, the forced selling in one fund's book became a losing trade in every other fund running a similar model, compounding losses across the industry within days.
Goldman Sachs's own Global Alpha fund is the clearest single casualty on record. Built by Asness's original team and later run by Mark Carhart and Raymond Iwanowski, Global Alpha peaked near $12 billion in assets and was described industry-wide as one of the premier quant funds of its era. It lost 7.7 percent in July 2007 alone, then 22.7 percent in August as the broader unwind accelerated, and never fully recovered, shrinking to roughly $1.6 billion before Goldman wound the fund down entirely by 2011. The strategies inside Global Alpha were not shown to be fundamentally broken. The problem was that too much capital, across too many funds, had converged on similar signals, turning a diversification thesis into a correlation nobody's model had priced, because it was not a market correlation at all. It was a shared-investor-base correlation, invisible until the moment everyone tried to exit through the same door simultaneously.
The failure mode unique to execution: when the code, not the thesis, is the risk
A second, entirely distinct quant-specific failure mode involves no crowded trade and no wrong statistical model at all: the infrastructure executing the strategy simply breaks. On August 1, 2012, Knight Capital Group, then one of the largest market makers in US equities, deployed new trading software to its production servers. A dormant piece of old test code, inadvertently left active on one of eight servers due to an incomplete deployment, began executing unintended orders the moment markets opened. Over the following 45 minutes, Knight's systems generated more than 4 million executions across 154 stocks, accumulating positions worth billions of dollars, roughly $3.5 billion long and $3.15 billion short, that made no economic sense and could not be halted through normal controls before a manual kill switch finally stopped the system. Unwinding the resulting position cost Knight $440 million, close to three times the firm's annual earnings, forced it to take on emergency financing that effectively transferred control of the company to its new creditors, and led to its acquisition within a year. Knight's underlying market-making business was not conceptually flawed. A single software deployment error was sufficient to erase 17 years of institutional history in under an hour, a risk category no amount of statistical rigor about the strategy itself can protect against.
The number almost nobody discloses: how many trials it took to find the good backtest
Both failure modes above are visible in hindsight and well documented. A third risk specific to quant strategies is far less visible, sits inside seemingly successful strategies before they ever lose a dollar, and is rarely disclosed at all: backtest overfitting. Modern computing lets a researcher test thousands or millions of variations of a trading strategy against historical data and simply report the one that performed best. The reported Sharpe ratio of that winning variation looks identical, on paper, to the Sharpe ratio of a strategy that was tested once and happened to work. Statistically, the two are nothing alike, because the more variations tried, the higher a Sharpe ratio pure chance alone is expected to produce eventually, with no genuine skill involved at all.
In 2014, David Bailey and Marcos Lopez de Prado published a direct mathematical correction for exactly this problem, the Deflated Sharpe Ratio, which adjusts a reported Sharpe ratio for the number of strategy variations tested, the length of the track record, and the statistical properties of the returns, producing a probability that the strategy's true, out-of-sample edge is actually greater than zero. The paper's own framing is blunt: the standard disclaimer that past performance does not guarantee future results is too lenient, because once selection bias from multiple testing is accounted for, a strategy that looks impressive on a backtest is often more likely to lose money out of sample than to repeat its reported performance. This is precisely the kind of consensus-priced number DN's Bottleneck Doctrine exists to interrogate: a Sharpe ratio is treated by nearly everyone, including many professional allocators, as a settled fact, when it is actually a number that means something completely different depending on information almost never disclosed alongside it.
The DN synthesis: how quant discipline differs from conviction discipline
Read against DN's earlier framework on legendary conviction investors, the quant tradition inverts nearly every assumption. Where Druckenmiller and Soros sized a position to match high conviction in a single macro view, quant strategies are built to work specifically because no single position or belief carries that much weight, the edge lives in the statistical process across thousands of small bets, not in any one of them. Where Dalio's diversification insight combines genuinely uncorrelated bets to reduce risk, quant funds face the opposite danger: strategies that look diversified on paper but are secretly correlated through a shared discovery process, the exact mechanism that turned August 2007 into an industry-wide event rather than one fund's bad month. And where a conviction investor's worst-case failure is being wrong about the world, a quant fund's worst-case failure is often being right about the world and still losing everything to a software deployment, a crowded exit, or a backtest that never should have been trusted in the first place.
The practical takeaway generalizes cleanly to any strategy claiming a statistical or systematic edge, in equities, in crypto, or in the DePIN and on-chain trading strategies increasingly marketed to DN's own readers: ask not just what the Sharpe ratio is, but how many variations were tried to find it, how correlated the strategy is to whatever else the same class of trader is running, and what happens to the position if the execution infrastructure itself fails at the worst possible moment. All three questions are usually more informative than the headline return number itself.
What this means for DN's readers
Crypto markets have already produced their own visible version of the Quant Quake pattern, correlated, thin-margin market-making and basis-trading strategies unwinding together during periods of stress, and their own version of Knight Capital, smart contract and bot execution failures that had nothing to do with whether the underlying trading logic was sound. The same diligence applies: a systematic strategy's backtested Sharpe ratio, whether presented by a CEX-listed trading bot, a DeFi vault, or a DePIN yield product, deserves the same skepticism this piece applies to Wall Street's quant funds.
For readers looking to build exposure to systematic and algorithmic strategies within crypto markets directly, spot and derivatives access is available through most major exchanges, including Bybit, OKX and MEXC. As always, this is not financial advice. A statistically rigorous edge and a lucky backtest can look identical on a single performance chart. The tool above exists to help tell them apart.
Frequently asked questions
What made Ed Thorp's approach to markets different from earlier investors?
Ed Thorp applied probability theory first to blackjack, developing a card-counting system published in 1962, then to options pricing, building quantitative models years before the Black-Scholes-Merton formula, and ran the market-neutral Princeton Newport Partners for roughly two decades without a losing year, demonstrating that markets contain small, quantifiable mathematical edges independent of any narrative or opinion about future prices.
How did Jim Simons's Renaissance Technologies achieve such consistent returns?
Renaissance Technologies' Medallion Fund averaged close to 66 percent annual returns before fees across roughly three decades by systematically identifying small, statistically persistent patterns across large datasets, an approach that has continued under CEO Peter Brown since Simons's death in May 2024, with Renaissance's institutional funds managing roughly $64 billion in assets as of early 2026.
What was the August 2007 Quant Quake?
During the week of August 6, 2007, multiple statistically similar, quantitatively managed equity market-neutral hedge funds experienced simultaneous, unprecedented losses after one or more large, similarly constructed portfolios were forced into rapid liquidation, causing losses to cascade across other funds running overlapping strategies even though the underlying signals were not shown to be fundamentally flawed.
What happened to Goldman Sachs's Global Alpha fund?
Global Alpha, a quantitative fund built by Cliff Asness's team and later run by Mark Carhart and Raymond Iwanowski, peaked near $12 billion in assets before losing 7.7 percent in July 2007 and 22.7 percent in August 2007 during the Quant Quake. The fund never fully recovered and was wound down by Goldman Sachs by 2011.
What caused Knight Capital's $440 million loss in 2012?
On August 1, 2012, a dormant piece of old test code was inadvertently left active during a software deployment to Knight Capital's trading servers. The code began executing unintended orders when markets opened, generating more than 4 million trades across 154 stocks in 45 minutes before the system was manually stopped, ultimately costing the firm $440 million and leading to its sale within a year.
What is the Deflated Sharpe Ratio?
Developed by David Bailey and Marcos Lopez de Prado in 2014, the Deflated Sharpe Ratio is a statistical correction to a reported Sharpe ratio that accounts for how many strategy variations were tested before the reported one was selected, along with the track record length and statistical properties of returns, producing an estimated probability that a strategy's true edge is genuinely greater than zero rather than a product of selection bias.
Why does the number of backtested variations matter for a Sharpe ratio?
The more strategy variations tested against historical data, the higher a Sharpe ratio pure random chance alone is statistically expected to eventually produce, even with zero genuine skill involved. A high Sharpe ratio selected from many tested variations is far less likely to reflect a real, repeatable edge than the same Sharpe ratio from a single strategy tested once.
How is statistical arbitrage different from macro or conviction-based investing?
Statistical arbitrage, pioneered at Morgan Stanley in the early 1980s, trades pairs or baskets of historically correlated securities based on temporary price divergence and expected mean reversion, requiring no directional view on where the overall market is heading, in contrast to macro investing, which depends on being correct about a specific economic or political outcome.
Why did Renaissance Technologies close its Medallion Fund to outside investors?
Statistical arbitrage strategies exploit small, often fleeting pricing inefficiencies, and deploying larger amounts of capital into the same signals tends to erode the returns those signals can generate, a phenomenon known as capacity constraint. Renaissance closed Medallion to outside investors in the early 1990s and has run it largely on employee capital since, widely interpreted as an acknowledgment of this capacity limit.





