Bridge Arbitrage 2026: How to Profit From Cross-Chain Crypto Price Gaps
The Bridge Arbitrage Guide: Same Token, Different Chain, Different Price.
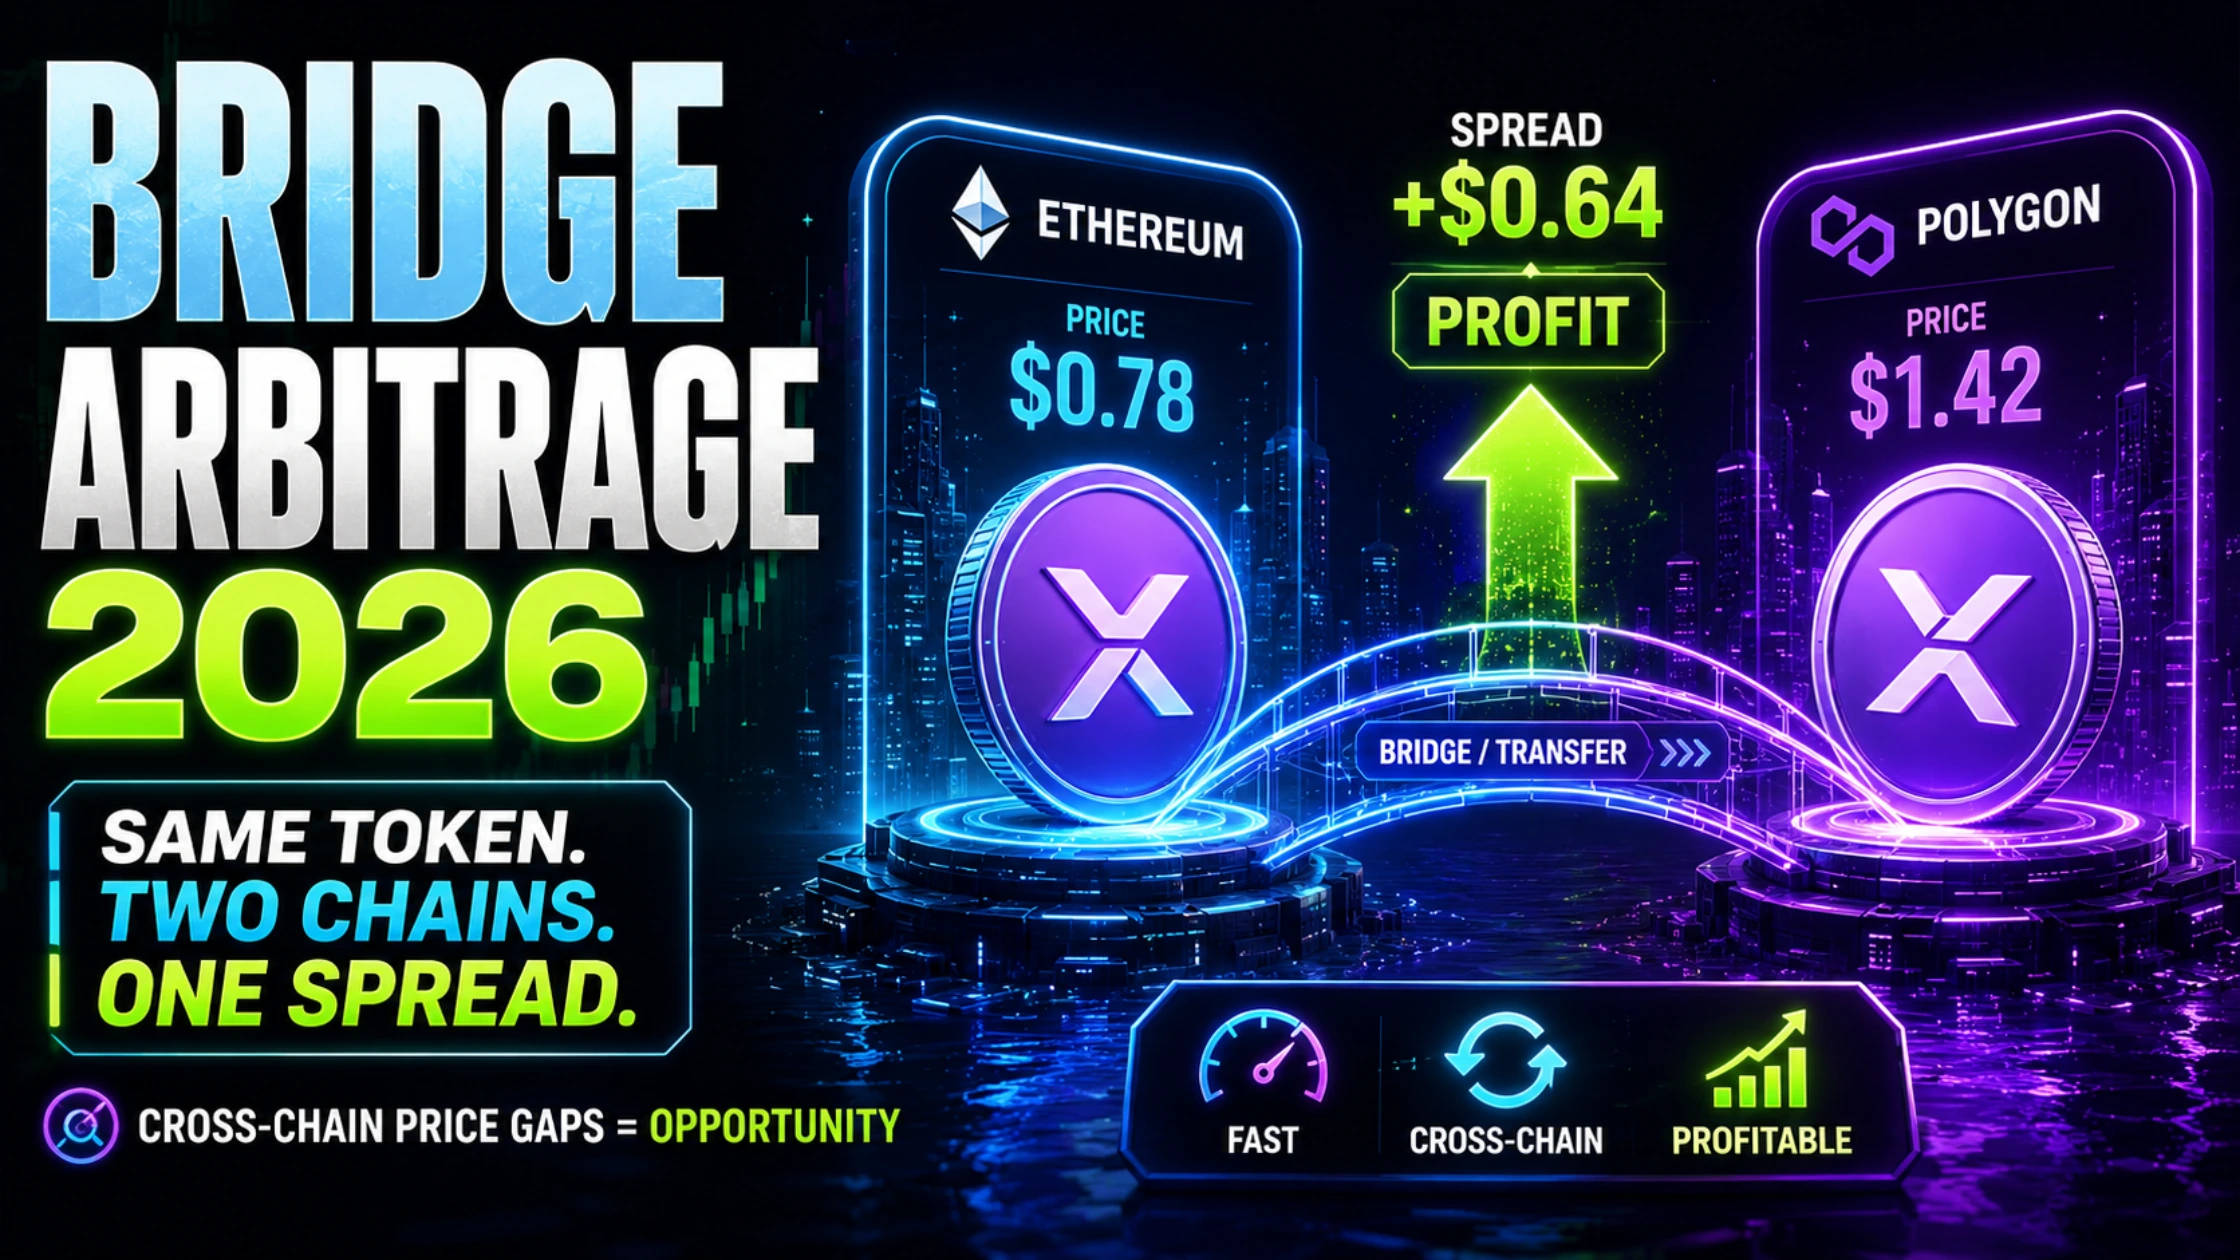
Bridge arbitrage is the practice of buying a token on one blockchain where it trades cheaply and selling it on another where the price is higher, with a cross-chain bridge as the transfer mechanism. Unlike centralized exchange arbitrage — which closes in milliseconds and requires institutional automation — bridge arbitrage windows last minutes to hours, making it one of the last retail-accessible arbitrage opportunities in 2026.
Why Bridge Arbitrage Still Exists When Everything Else Has Been Automated Away
Every profitable arbitrage opportunity in finance eventually gets automated out of existence. CEX-to-CEX spread trading lasted roughly three years before high-frequency firms closed every gap faster than any human could see it. On-chain DEX arbitrage on Ethereum lasted months before MEV bots started front-running every transaction. Statistical arbitrage across correlated pairs is now dominated by quant funds running co-located infrastructure.
Bridge arbitrage has survived precisely because bridging is slow.
A transaction on Ethereum finalizes in roughly 12 seconds. A bridge transfer from Ethereum to Arbitrum takes 10 to 20 minutes for the standard route, and Ethereum to Solana via a third-party bridge can take 5 to 25 minutes depending on congestion, validator set, and the specific bridge protocol used. During that window, a human can find the opportunity, calculate whether it is profitable, initiate the bridge transaction, and execute the sale on the destination chain.
No institutional algorithm dominates this space the way they dominate CEX trading because the infrastructure cost of running automated bridge arbitrage at scale — monitoring hundreds of token pairs across dozens of chains simultaneously, maintaining funded positions on each chain, managing bridge failure risk — is genuinely high. The result is a category of opportunity where a retail trader with a well-funded multi-chain wallet, a fast internet connection, and the right analytical framework can compete.
The operative phrase is “if you’re fast enough.” The window is real. It is not, however, guaranteed to stay open for the 20 minutes your bridge takes to confirm. Understanding the time-decay risk on any specific trade is the difference between a systematic edge and an expensive lesson.

How Bridge Price Discrepancies Form
To trade bridge arbitrage systematically, you need to understand why the same token trades at different prices on different chains — and how long those discrepancies typically last.
Liquidity fragmentation is the root cause. When a token exists natively on Ethereum and as a bridged representation on Arbitrum, Base, Solana, or any other chain, its price on each chain is set independently by the liquidity pools and order books present there. A large buy order that moves the price 1.5% on a shallow Arbitrum pool has no immediate effect on the Ethereum price. The information needs to travel via an arbitrageur — which is you.
New token launches create the largest gaps. When a token launches on Base and is bridged to Ethereum hours later, the price discovery process on each chain is independent. During active price discovery, spreads of 2 to 8% are not uncommon. These are the highest-potential bridge arb opportunities and also the riskiest, because the price is moving quickly in both directions.
Low-liquidity chains have persistent micro-spreads. On chains with thin DEX liquidity — smaller EVM chains, newer L2s, certain Solana ecosystem tokens — price discrepancies of 0.3 to 0.8% can persist for hours because the liquidity to correct them simply is not present. These are lower risk and lower reward.
High-volatility events on one chain temporarily dislocate prices. When a whale makes a large trade on Arbitrum that moves a token price 2%, the correction on Ethereum or Base can lag by several minutes while arbitrageurs respond. These event-driven gaps are brief but occur frequently in active markets.

The Five Numbers That Determine Whether a Bridge Arb Trade Is Profitable
Before executing any bridge arbitrage trade, you need to calculate five numbers. The tool below automates this, but understanding the logic behind each one is what separates systematic traders from hopeful ones.
- The gross spread. The raw price difference between Chain A and Chain B, expressed as a percentage of the lower price. A token priced at $10.00 on Ethereum and $10.18 on Arbitrum has a 1.8% gross spread. This is the maximum you can make before costs.
- Bridge cost. Every bridge charges a fee, usually structured as a fixed component (gas on both chains) plus a percentage of the transferred amount. deBridge, one of the fastest bridges for EVM chains, charges approximately $0.50 to $2.00 in fixed gas costs plus 0.04 to 0.1% of the transfer value. Stargate charges similar rates. Wormhole for Solana-to-EVM transfers charges higher variable fees depending on validator set congestion.
- Slippage cost. You are buying on Chain A and selling on Chain B through DEX pools. Any buy or sell of meaningful size moves the price against you. On a $5,000 trade in a pool with $200,000 of liquidity, your slippage is approximately 1.25% on each side — roughly 2.5% round trip. This is often the single largest cost in a bridge arbitrage trade and the one most traders underestimate.
- Time-decay risk. The spread exists right now. Will it still exist when your bridge transfer completes? The answer depends on two variables: how fast the bridge moves and how volatile the token is. A 1.8% spread on a token with 3% daily volatility has a meaningful probability of disappearing or reversing during a 15-minute bridge window. The expected price move during any transfer window can be estimated from the token’s historical daily volatility using the square root of time scaling: Expected move = Daily volatility × √(transfer minutes / 1440).
- Net profit probability. The combination of your net profit after costs and the probability that the spread persists. A trade with $120 net profit on paper but 60% probability of the spread closing before transfer completes has an expected value of $48 — very different from a trade with $80 net profit and 85% persistence probability, which has an expected value of $68.

Use This Before Every Bridge Arb Trade
The calculator below runs all five calculations in real time. Input your trade parameters and the tool outputs gross profit, full cost breakdown, time-decay risk assessment, and a probability-weighted profit rating.
Bridge Arbitrage Calculator
Calculate real net profit, costs, and time-decay risk before executing any cross-chain arbitrage trade.
Tool by Decentralised News · Execute via deBridge
Where to Actually Find Bridge Arbitrage Opportunities
Knowing how to calculate a bridge arb trade is necessary but not sufficient. You also need to find the opportunities before they close. Here is the workflow used by active bridge arbitrage traders in 2026.
Step 1: Monitor cross-chain price aggregators. GeckoTerminal and Dexscreener both show the same token’s price across multiple chains simultaneously. Open a token you follow and check whether the price on each chain tab matches. Any divergence above 0.5% is worth running through your calculator.
Step 2: Watch new token launches on Virtuals and Base. When a new token launches on Base and is bridged to Ethereum or Solana shortly after, the price discovery gap is frequently large enough to be profitable. The highest bridge arb opportunities of 2025 and 2026 have come from new AI agent tokens launching on Virtuals Protocol where Base liquidity was established hours before Ethereum pools caught up.
Step 3: Follow large on-chain transactions. Nansen and Arkham Intelligence flag large wallet movements. A $500,000 buy on Arbitrum that moves a token’s price 3% while the Ethereum price has not yet reacted is a real bridge arb setup. By the time most traders see it on Twitter, it is often already closed — but you have seconds to a minute of advantage if you are watching the data directly.
Step 4: Monitor bridge-specific price feeds. deBridge’s interface shows the exchange rate for a given token across supported chains at the moment of bridging. If the rate offered implies a destination value higher than the current source price plus costs, the bridge itself is advertising the arbitrage.
Step 5: Use DeFiLlama’s cross-chain price comparison. DeFiLlama maintains price data for thousands of tokens across their native and bridged representations. The “bridge” section of their interface regularly surfaces tokens with meaningful cross-chain discrepancies.
Step-by-Step Execution: How to Actually Run a Bridge Arb Trade
Theory without execution is useless. Here is the complete workflow for executing a bridge arb trade, using deBridge as the primary transfer mechanism and OKX Web3 Wallet as the multi-chain interface.
Pre-trade setup (do this once, not during a live opportunity):
Pre-fund wallets on every chain you intend to trade. Bridge arb execution requires that you already have gas tokens on the destination chain before the opportunity appears. Scrambling to bridge ETH to Arbitrum for gas while a price discrepancy is closing is how opportunities are missed. Maintain a minimum gas balance on at least four chains: Ethereum, Arbitrum, Base, and Solana.
The OKX Web3 Wallet handles multi-chain management in a single interface — you can see balances, execute swaps, and initiate bridge transfers across all major EVM chains and Solana from one dashboard without switching between multiple wallets or browser extensions.
During a live opportunity:
- Confirm the spread on both chains using GeckoTerminal or Dexscreener. Record the exact prices and the timestamp.
- Run the numbers through the bridge arb calculator. If net profit probability comes out as High or Moderate, proceed. If it comes out as Low, pass.
- Initiate the bridge transfer via deBridge. deBridge offers deSwap, which executes the swap on the source chain and delivers the destination asset in a single transaction — reducing the number of steps and therefore the execution time. Select the fastest available route, not the cheapest. In bridge arbitrage, time costs more than fees.
- While the bridge transfer is in progress, prepare the sell order on the destination chain DEX. Do not execute it yet. Set a limit order at your target sell price if the DEX supports it, which most modern aggregators including Odos and 1inch Fusion do. This lets you lock in a sell price while waiting for the transfer.
- Monitor the price on the destination chain during the transfer window. If the price has already moved to within 0.2% of the source chain price before your transfer completes, the trade has likely already been closed by a faster arbitrageur. Accept the bridge delivery, reassess, and consider whether you still want to sell or hold.
- On transfer confirmation, execute the sell immediately. Do not second-guess, do not wait for a better price. The arb trade thesis was the spread, not a directional view on the token. Get in, get out, calculate the result.

The Risks Nobody Mentions in Bridge Arbitrage Guides
The opportunity is real. The risks are also real and under-discussed.
Bridge failure and stuck transactions. Bridges fail. Messages between chains can get stuck in validator queues, oracles can lag, and smart contract bugs do occasionally materialize. In most failure scenarios, funds are eventually recovered, but the resolution can take hours to days. A bridge arb position stuck in transit during a 20% market move is a deeply unpleasant experience. Stick to audited, battle-tested bridges — deBridge, Stargate, and LayerZero’s canonical bridges — and avoid newly launched bridge protocols regardless of how attractive their fees appear.
Slippage at execution. On destination chains with thin liquidity, your sell order itself can move the price enough to eliminate your profit. A 1.8% gross spread with 1.6% total slippage on a $10,000 trade nets $20 before bridge fees. The calculator above forces you to input slippage estimates honestly. Never set slippage tolerance above 1% on your sell without recalculating whether the trade is still worth running.
The spread closing mid-bridge. This is the most common failure mode. You see a 2% spread, initiate the bridge, and by the time your transfer confirms, a faster arbitrageur has closed it. You now own the token on the destination chain at a price above or equal to what it trades on the source chain. You are left holding either at a small loss or breaking even. This is not catastrophic but it is the rule rather than the exception during high-activity periods when many eyes are watching the same price gap.
Smart contract risk on destination chain DEXes. Every swap on a DEX is a smart contract interaction. In bridge arbitrage you are executing on unfamiliar contracts under time pressure. The combination of time pressure and unfamiliar contracts is exactly the environment in which people approve malicious tokens, interact with phishing interfaces, or accidentally grant excessive permissions. Use established aggregators — Odos, 1inch, Jupiter for Solana — and verify contract addresses before approving anything.

The Best Chains and Bridges for This Strategy in 2026
Not all chain pairs are equal for bridge arbitrage. The opportunity quality depends on bridge speed, available liquidity depth, and how active other arbitrageurs are on the pair.
Ethereum to Arbitrum is the highest-volume pair for bridge arb and the most competitive. Spreads close quickly. Most opportunities require sub-5% spread to be worth the competitive risk. The fast path via Arbitrum’s native bridge to deBridge takes 8 to 15 minutes.
Ethereum to Base has become the highest-opportunity pair in 2026 due to the explosion of AI agent token launches on Base via Virtuals Protocol. New token launches frequently create 3 to 8% spreads that take 10 to 30 minutes to close as liquidity migrates between chains. The OKX Web3 Wallet natively supports both chains and Base’s sub-cent gas fees make the cost of an exploratory bridge relatively low.
Solana to Ethereum is the highest-risk, highest-reward pair. Bridge times run 5 to 25 minutes depending on validator congestion, and Solana’s high-speed price discovery means spreads can open and close rapidly. Wormhole and deBridge both support this corridor.
Arbitrum to Base is emerging as the most efficient pair for retail bridge arb in 2026. Both are OP Stack chains with shared validator infrastructure, bridge times of under 5 minutes via third-party bridges, and growing liquidity in the AI agent token category. The short transfer window dramatically reduces time-decay risk.
For bridging across all of these corridors, deBridge remains the most versatile retail-accessible solution, combining competitive fees, multi-chain support, and the deSwap functionality that executes the source chain swap and the bridge transfer in a single transaction.

Realistic Expectations: What Bridge Arbitrage Actually Earns
Bridge arbitrage is not a path to consistent five-figure monthly returns for retail traders. Setting realistic expectations is what separates sustainable practice from burnout.
In active market conditions with high cross-chain volume — new narrative launches, high overall market volatility, fresh protocol deployments — an experienced bridge arb trader with $20,000 to $50,000 deployed across funded wallets might find two to five viable opportunities per week. Average net profit per successful trade in the $5,000 to $15,000 trade size range is typically $50 to $300. Monthly gross income from the strategy, when opportunities are plentiful, might reach $600 to $1,500 on a $20,000 capital base — a 3 to 7.5% monthly return, or 36 to 90% annualized.
In quiet market conditions with low cross-chain volume — ranging markets, established tokens with deep liquidity on every chain — viable opportunities become rare. Going a week without a single trade that clears the calculator’s hurdle is normal. The strategy is intermittent, not continuous.
The capital efficiency constraint is the binding limitation. Unlike a grid bot or a funding rate carry trade, bridge arbitrage capital is not working between opportunities. The funds sitting on six different chains waiting for the next gap are earning nothing during the dead periods. Pairing bridge arb capital with a baseline yield strategy — stablecoin lending on Aave or Ondo’s USDY for idle capital — is the professional approach to managing the opportunity cost.
For active bridge arb execution on the chains that matter most in 2026, BloFin provides the CEX infrastructure for pairs that also trade on centralized venues, giving you the option to hedge a bridge position with a CEX short if the spread is large enough to justify both legs.
FAQ
What is bridge arbitrage in crypto? Bridge arbitrage is buying a token on one blockchain where it trades at a lower price and selling it on another blockchain where the price is higher, using a cross-chain bridge to transfer the asset between chains. The profit is the difference between the two prices, minus bridge fees, gas costs, and slippage on both transactions.
Is bridge arbitrage still profitable in 2026? Bridge arbitrage remains profitable for retail traders in specific situations — primarily during new token launches, high-volatility events, and on chain pairs with fast bridge infrastructure. The opportunity set is smaller and more competitive than in 2022 to 2023 but has not been fully automated away because the capital requirements and operational complexity of running automated bridge arb at scale remain high enough to deter full institutional domination.
Which bridges are best for arbitrage in 2026? deBridge and Stargate are the most reliable and cost-efficient bridges for EVM chain pairs. deBridge’s deSwap functionality, which combines source chain swapping and bridging in one transaction, is specifically useful for arbitrage execution speed. For Solana-to-EVM transfers, Wormhole remains the dominant option despite higher variable fees.
What is the minimum capital needed for bridge arbitrage? There is no hard minimum, but bridge arb becomes economically meaningful at trade sizes of $3,000 and above. Below this threshold, fixed bridge fees and gas costs consume a disproportionate share of any gross spread. Most active bridge arb traders operate with $5,000 to $20,000 per trade and maintain funded wallets across at least four chains simultaneously.
What is time-decay risk in bridge arbitrage? Time-decay risk refers to the probability that a price spread closes or reverses before a bridge transfer completes. During a 15-minute bridge window, a token with 3% daily volatility has an expected price move of approximately 0.74% — meaning a 1% gross spread has a meaningful probability of being eliminated or reversed by the time the transfer confirms. The bridge arb calculator above quantifies this risk for any token and bridge window combination.
How is bridge arbitrage taxed? In most jurisdictions, each completed bridge arb cycle involves two taxable events: the purchase on Chain A and the sale on Chain B. The profit is typically treated as short-term capital gains (since the hold period is measured in minutes). Bridge fees may be deductible as a cost basis addition or trading expense depending on jurisdiction. Use Koinly or CoinTracker to log each transaction with timestamps and chain identifiers from the moment you start.
Execute your next bridge arb trade: deBridge for cross-chain transfers | OKX Web3 Wallet for multi-chain management | BloFin for CEX hedging on dual-listed pairs
Recommended reading:
Funding Rate Arbitrage: How to Earn Consistent Yield by Trading the Sign Flip in 2026
Funding Rate Arbitrage: The 8% Monthly Yield Machine (2026 Edition)
Funding Rate Arbitrage: The 200% APY Strategy Nobody Talks About
The Funding Rate Arbitrage Playbook: 6 Exchanges Where Basis Trading Still Prints 15%+ APY in 2026
Perpetual Futures Trading in 2026: Best Platforms, Strategies, Funding Rates, Risk Models & Pro Tips
Best Funding Rate Arbitrage Platforms (2026)


