Where Are We in the Bitcoin Cycle Right Now?
The Bitcoin Halving Tracker: 2017, 2021 and 2026 Compared.
Where is Bitcoin in the four-year halving cycle right now, and what happened at this exact point in the 2013, 2017, and 2021 cycles? This tracker shows your cycle position and the historical analog, with no live price feed required.
The Bitcoin Halving Cycle Tracker: Where Are We in the Cycle Right Now?
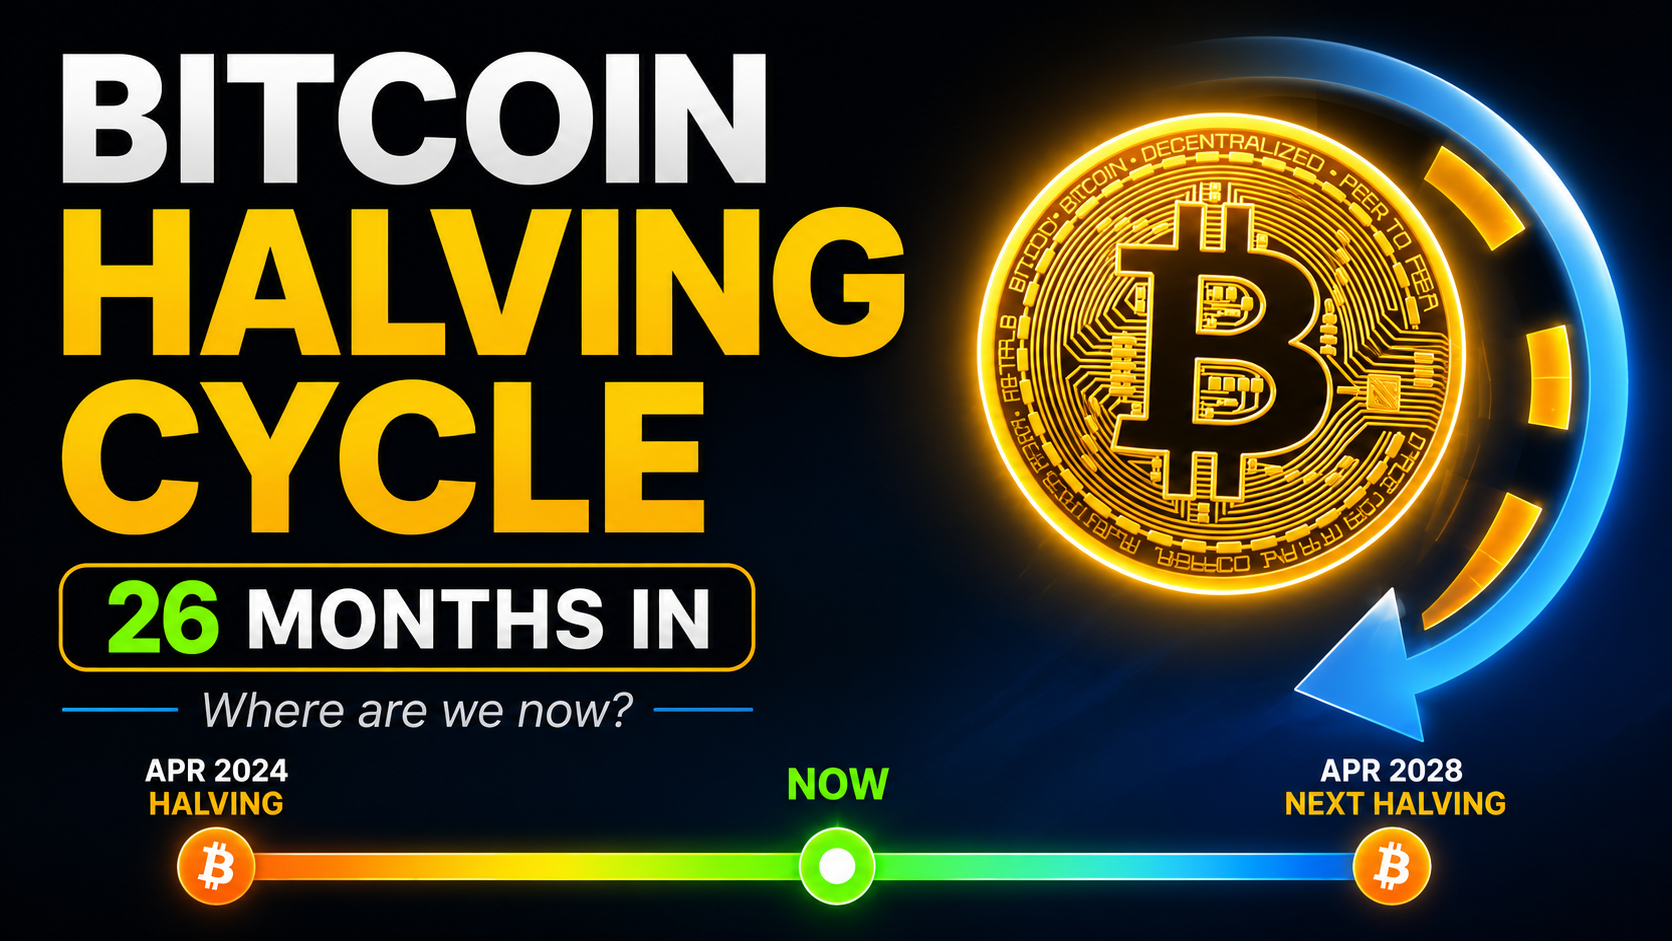
Bitcoin’s most recent halving occurred on April 20, 2024, at block 840,000, reducing the block reward from 6.25 BTC to 3.125 BTC. The next halving is expected on April 17, 2028, at block height 1,050,000. As of today, the network sits roughly 26 months into the current four-year cycle, past the point in both the 2017 and 2021 cycles where the previous cycle peak occurred. The tracker below shows exactly where today’s date falls within that cycle, what the equivalent point looked like in 2013, 2017, and 2021, and a position-sizing framework based on which phase the data suggests we are in.
Why the Four-Year Cycle Still Matters
Bitcoin halvings occur every 210,000 blocks, which at a roughly 10-minute average block time works out to approximately every four years. Four halving events have taken place since Bitcoin’s inception in 2009: the first in November 2012, the second in July 2016, the third in May 2020, and the fourth in April 2024.
The mechanism is simple supply economics: when demand levels for an asset remain constant but supply is reduced, the asset tends to appreciate, and Bitcoin’s halvings cut new supply issuance in half on a fixed schedule regardless of demand conditions at the time. Bitcoin’s price surged 8,450% in the cycle following the first halving, 290% following the second, and 560% following the third, a pattern consistent enough across three full cycles that it became one of the most widely tracked frameworks in all of crypto.
The honest caveat that belongs at the front of any halving cycle discussion: past performance does not guarantee future results, and the market can be highly volatile and speculative. Each cycle has also produced a smaller percentage return than the one before it, a diminishing-returns pattern that is itself worth tracking, since it implies the cycle’s shape may be evolving even if its general rhythm persists. It is still unclear what happens after the current cycle’s halving, with many believing price will follow a similar pattern to the previous three, rising as new coin supply tightens.
Where We Are Right Now
The Bitcoin halving event completed at block 840,000 on April 20, 2024. Counting forward from that date to today places the network at approximately month 26 of the roughly 48-month cycle, putting us just past the halfway point and into the second half of the current four-year period. The next halving is expected around April 17, 2028, meaning roughly 22 months remain until the supply shock that has historically preceded each major bull phase repeats.
This specific position, month 26, is worth dwelling on because of what it represents relative to history. In the two most recent completed cycles, the cycle peak arrived earlier than this. The 2016-cycle peak landed around month 17 post-halving. The 2020-cycle peak landed around month 18 post-halving. Month 26 in both of those prior cycles was already well into the post-peak decline, not still building toward a top. Whether the current cycle is following that same compressed timing, has already peaked, or is instead stretching into a longer, flatter cycle than its predecessors, a thesis some analysts attribute to the smoothing effect of spot ETF inflows and growing institutional participation, is the single most important open question the tracker below is designed to help you think through.
Use the Cycle Tracker
Bitcoin Halving Cycle Tracker
Enter today's BTC price to see your exact cycle position, compared against the equivalent point in the 2013, 2017, and 2021 cycles.
Indexed price trajectory — current cycle vs. historical analogs
Each line shows % change from halving-day price, by months since halving. Halving day = 100%.
Tool by Decentralised News · Execute on OKX · Bybit · Cold storage: Ledger
The Three Historical Analogs, Explained
Cycle 2 (2016 to 2020), peak at month 17. Bitcoin traded near $650 at the July 2016 halving. The price moved gradually through 2016 and most of 2017 before a parabolic final run into December 2017, when it touched approximately $19,800, a peak that arrived 17 months after the halving and was followed by a roughly 18-month decline into the next cycle’s accumulation phase.
Cycle 3 (2020 to 2024), peak at month 18. Bitcoin traded near $8,600 around the May 2020 halving. This cycle had a notable mid-cycle correction in mid-2021 before recovering to a final peak near $69,000 in November 2021, 18 months after the halving, followed by the 2022 bear market that bottomed around the FTX collapse roughly 12 months later.
Cycle 4 (2024 to 2028), current cycle. Bitcoin traded at $64,262 on the day of the April 2024 halving. This cycle has displayed a meaningfully different shape than its two predecessors, a slower initial post-halving move, a sharp acceleration following the November 2024 US election, and an all-time high reached earlier in the cycle’s percentage-of-elapsed-time than either of the prior two cycles, before consolidating through 2026. Whether month 26 represents a pause within an extended uptrend or the early stage of a post-peak decline is exactly the question the indexed comparison chart in the tool is built to surface.
How to Read the Phase Classification
The tracker classifies the current position into one of four phases, each carrying a different, generic positioning framework. This is explicitly not individualized financial advice, it is a structural framework for thinking about risk exposure at different cycle stages, which you should adapt to your own risk tolerance and time horizon.
Accumulation phase (typically months 0 to 10 post-halving, historically the slowest and least exciting period). Historical pattern: price drifts sideways to modestly higher, public attention is low, and the supply shock has not yet meaningfully outpaced new buyer demand. This is historically when patient, dollar-cost-averaged accumulation has produced the best risk-adjusted entries across all three completed cycles.
Early bull phase (typically months 10 to 15, the period of accelerating but not yet euphoric price action). Historical pattern: price begins a sustained uptrend, broader retail attention starts returning, and altcoins typically begin outperforming Bitcoin as risk appetite expands across the market.
Peak zone (typically months 15 to 20, where both prior completed cycles topped out). Historical pattern: parabolic, euphoric price action, broad mainstream attention, and historically the period where reducing risk and taking some profit has been more often rewarded than punished across the two prior completed cycles.
Post-peak phase (months 20 onward through the next halving’s approach). Historical pattern: extended drawdown from cycle highs, declining public interest, and historically where the next cycle’s eventual accumulation phase has begun forming, though the timing and depth of this phase has varied considerably between cycles 2 and 3.
Position Sizing by Phase: A Generic Framework
If the tracker places you in accumulation: Historical precedent favors systematic, recurring buys over lump-sum deployment, since the exact bottom is unknowable in real time and accumulation-phase price action has historically rewarded patience over timing precision. Self-custody via Ledger is most relevant here, since accumulation-phase holdings are typically the longest-duration, lowest-need-for-liquidity portion of a portfolio.
If the tracker places you in early bull: This has historically been the phase where increasing exposure, including to higher-beta altcoins relative to Bitcoin specifically, has produced the strongest risk-adjusted returns across the two completed cycles with sufficient data. OKX and Bybit both provide the spot and derivatives infrastructure for scaling exposure during this phase.
If the tracker places you in the peak zone: Historical precedent favors disciplined partial profit-taking and reduced leverage specifically, since both prior completed cycles saw severe (50%+) drawdowns within months of their respective peaks. This is the phase where the discipline frameworks covered in our professional risk management guide matter most.
If the tracker places you post-peak: Historical precedent favors capital preservation and gradual re-accumulation rather than aggressive re-entry, since both prior post-peak phases saw further significant declines (additional 30 to 50% drawdowns from already-reduced levels) before the next cycle’s true accumulation phase began.
FAQ
When is the next Bitcoin halving?
The next Bitcoin halving is expected on April 17, 2028, at block height 1,050,000, though the exact date is an estimate that shifts slightly as block times vary, with block height being the more precise anchor than any specific calendar date.
Has Bitcoin already peaked in the current cycle?
This cannot be answered with certainty in real time, only in retrospect. The tracker above shows where the current cycle’s price trajectory sits relative to the equivalent point in the two prior completed cycles, both of which had already passed their peak by month 26. Whether the current cycle is following that same timing or extending into a longer cycle is the genuinely open question this tool is designed to help you monitor, not resolve definitively.
Why has each Bitcoin cycle produced smaller percentage gains than the last?
Bitcoin’s price surged 8,450% after the first halving, 290% after the second, and 560% after the third, a clear diminishing-returns pattern. The most commonly cited explanation is Bitcoin’s growing market capitalization: each successive cycle requires proportionally larger dollar inflows to produce the same percentage price move, since the asset’s base has grown from billions to over a trillion dollars across the completed cycles.
Should I buy Bitcoin based on where the tracker says we are in the cycle?
The tracker is a historical pattern-recognition tool, not a prediction system. Past performance does not guarantee future results, and the cryptocurrency market can be highly volatile and speculative. Use the cycle position as one input among several, alongside your own risk tolerance, time horizon, and broader market analysis, rather than as a standalone buy or sell signal.
How is the current cycle different from the 2017 and 2021 cycles?
The clearest structural difference is institutional participation through spot Bitcoin ETFs, which did not exist in either prior cycle and which some analysts believe smooths and extends price cycles by introducing a steadier, less retail-driven flow of capital. Whether this genuinely changes the cycle’s shape and timing, or simply delays the same eventual pattern, remains an open and actively debated question among serious market analysts.
Execute your cycle-phase strategy: OKX — spot and derivatives access for early bull and peak-zone positioning · Bybit — derivatives infrastructure for risk management through peak and post-peak phases · Ledger — cold storage for accumulation-phase holdings


