
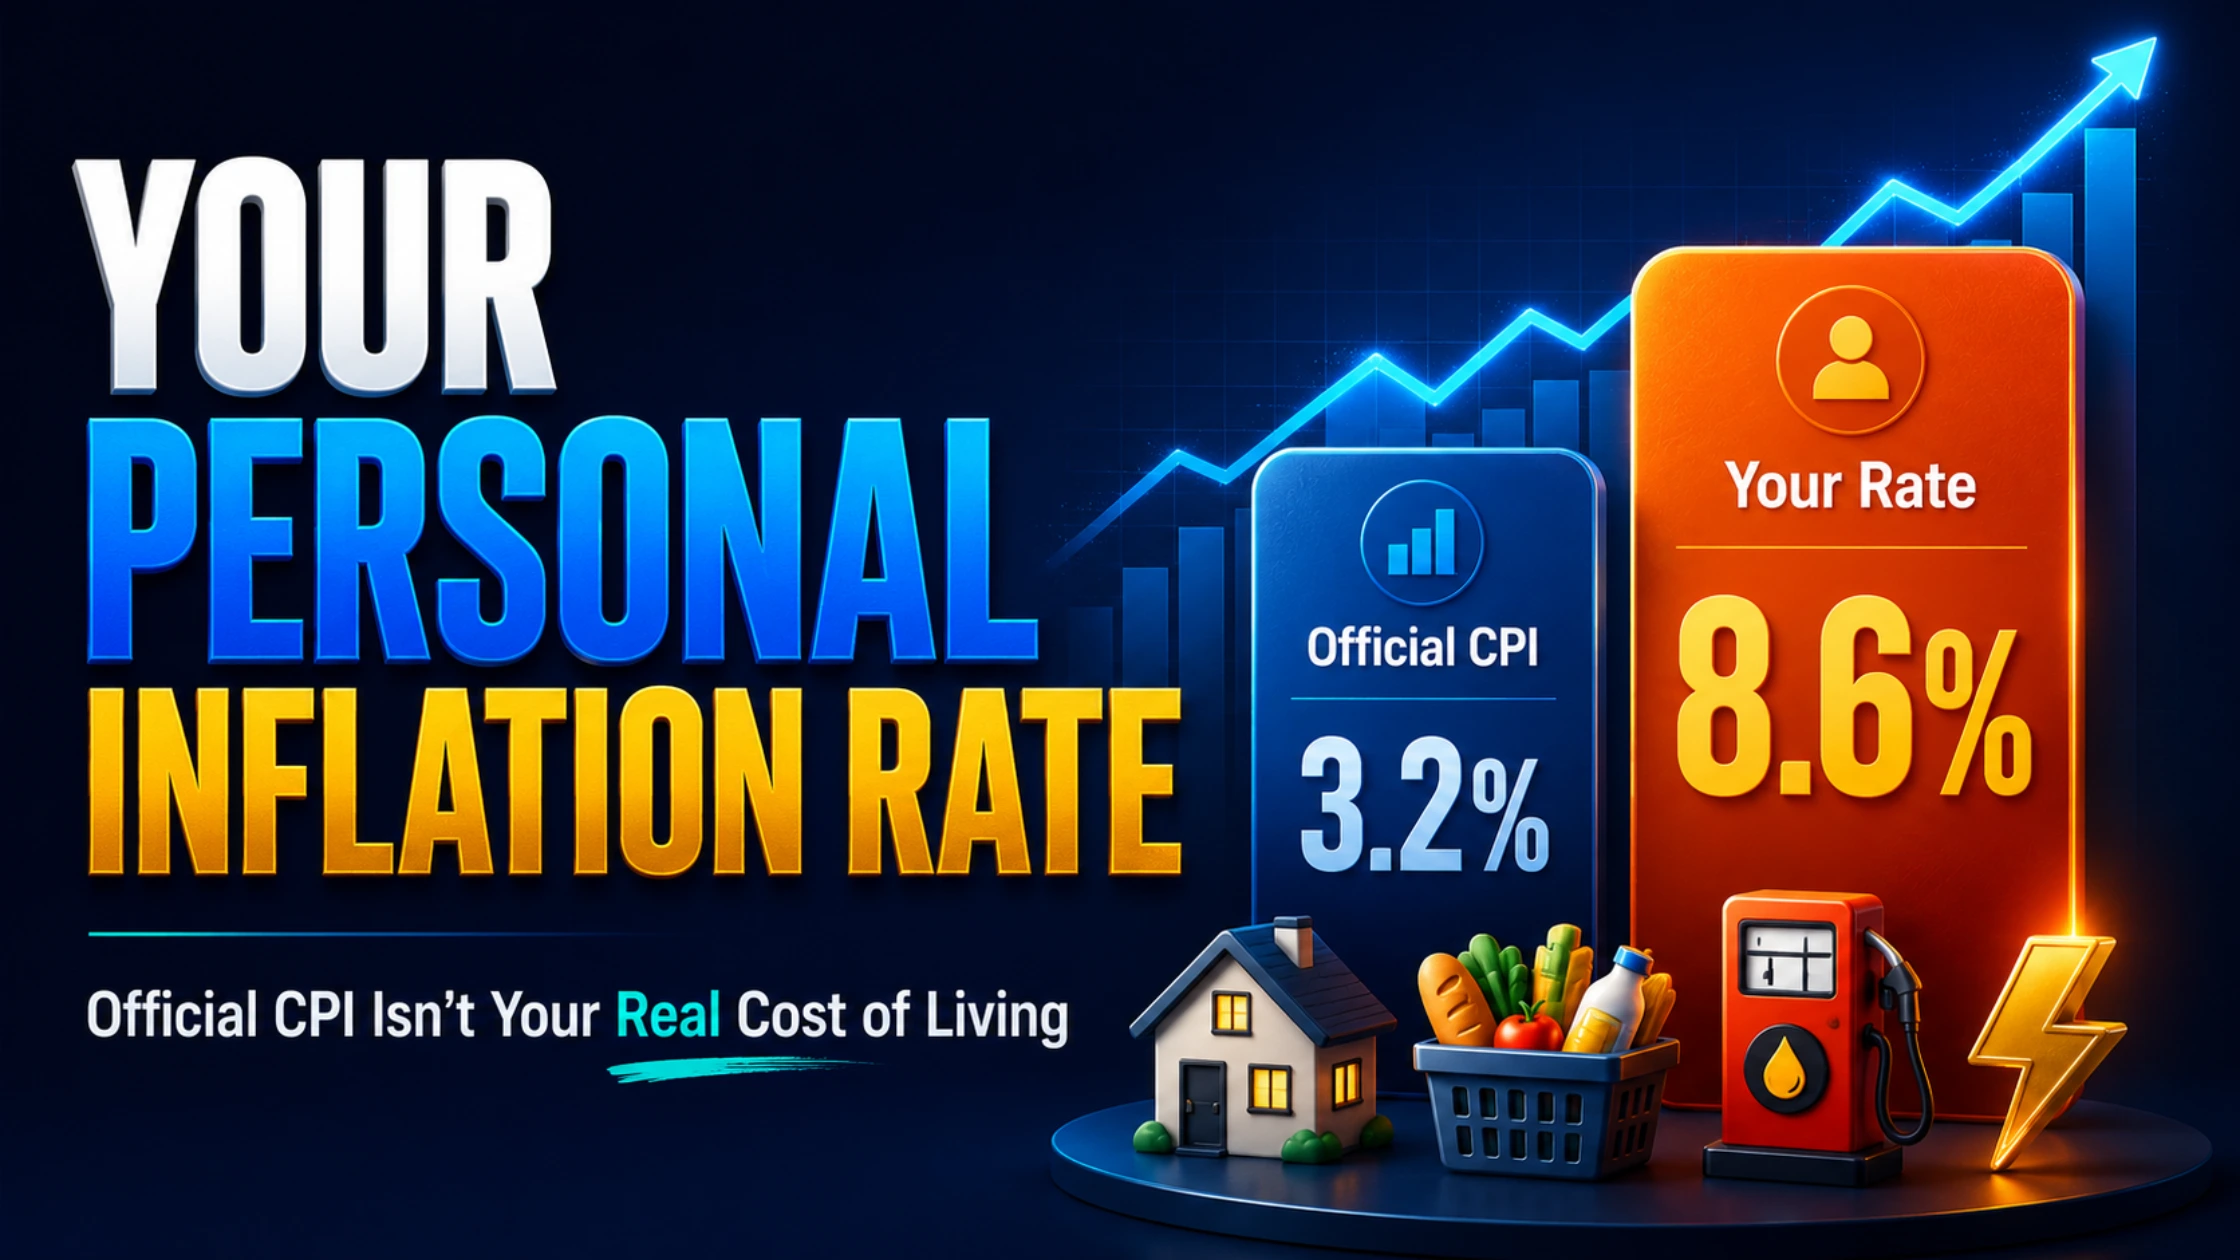
The official inflation rate is an average for a household that does not exist. Build your own personal CPI with our free tool, see your true cost-of-living increase, and learn exactly what your money must earn to stop losing value in 2026.
Quick summary
The headline inflation rate your government publishes is a national average across a fixed basket of goods, weighted for a statistically typical household. You are not that household. If you rent rather than own, drive rather than take transit, eat more beef than the average, or live in an expensive city, your true cost-of-living increase can run well above the official figure. In April 2026, the United States reported headline inflation of 3.8 percent, yet energy prices were up 17.9 percent, gasoline 28.4 percent and beef nearly 15 percent over the year, while the euro area sat at 3.0 percent and South Africa at 4.0 percent. A driver who eats meat experienced a completely different year from a homebody cyclist, even though both were told inflation was “under 4 percent.” Your personal inflation rate is the spend-weighted average of the price rises you actually face, and once you know it, you know the single most important number in personal finance: the return your money must earn, after tax, simply to stop losing value. Build yours with the tool on this page in two minutes.
The number that runs your life is an average you have nothing to do with
Every month, a statistics agency announces a single figure and the financial world reorganises itself around it. Central banks set interest rates by it. Wages, pensions and benefits are adjusted by it. Headlines declare that inflation is cooling or heating, and millions of people quietly conclude that their own struggle to make ends meet is either justified or imaginary based on whether the official number went up or down.
There is just one problem. That number describes the spending of a household that does not exist. It is a weighted average across a representative basket, built for a statistical composite of an entire nation. The retired couple who own their home outright, the young renter who commutes ninety minutes a day, the family of five who eat meat every night and the single professional who orders delivery all get handed the same figure, as if they were living the same life. They are not. And the gap between the published rate and the rate you actually live is not a rounding error. In a year like 2026, it can be the difference between getting ahead and falling quietly behind.
This article gives you the tool to close that gap, and the framework to act on what it tells you. We call the output your Personal Inflation Rate, and it is the first reading in a family of proprietary Decentralised News instruments, alongside the Debasement Clock and the Real Yield Ladder, designed to measure what the official statistics smooth over.

How the official rate is built, and where it quietly diverges from your life
The official consumer price index is not a conspiracy. It is a genuine, careful attempt to measure the price of a representative basket, and understanding how it is constructed is the key to seeing why your experience differs so sharply.
A statistics agency divides all household spending into a handful of broad categories and assigns each a weight reflecting how much a typical household spends on it. In the United States, the Bureau of Labor Statistics uses eight major groups, reweighted each year, with the most recent update in December 2025. Housing dominates, food and transportation come next, and smaller slices go to medical care, recreation, apparel and the rest. Energy, notably, is not a standalone category at all but an aggregate scattered across housing and transport, carrying a weight of roughly six per cent of the whole index. The agency then tracks the price of each component and blends them by those fixed weights into one number.
Three features of that process explain most of the divergence you feel. The first is the weighting itself. The index assumes you spend the national-average proportion on each category, but you do not. If a third of your income goes to rent while the basket assumes a smaller share, then a surge in rents hits you far harder than the headline implies. The second is substitution. The methodology assumes that when steak gets expensive, people switch to chicken, and the index increasingly reflects the cheaper choice. That is realistic behaviour, but it quietly measures the inflation of a household that keeps trading down rather than the cost of maintaining your existing standard of living. The third is quality adjustment, sometimes called hedonics. When a product improves, statisticians may record part of a price increase as paying for better quality rather than as pure inflation, which is defensible in theory but means the sticker price you pay can rise faster than the official index for that item.
None of this is fraudulent. All of it is debated by honest economists. But the cumulative effect is clear and it is not in your favour: the published rate systematically describes a more flexible, more average, more downwardly-substituting household than the real you, who has a lease to pay, a car to fuel and a family with fixed habits.

2026 is the year the gap became impossible to ignore
In an ordinary year, the divergence between the headline and your lived experience is a slow background hum. In 2026 it became a roar, because the inflation that returned was concentrated in exactly the categories that are unavoidable and that vary most between households.
The trigger was geopolitical. Following the strikes on Iran in late February, the resulting oil shock rippled through energy markets worldwide. In the United States, headline inflation had eased to 2.4 percent before the conflict. By April it had jumped to 3.8 percent, the highest reading in nearly three years, and forecasters at major firms warned it could breach 4 percent in May. But the headline drastically understated the pain at the point of consumption. Energy was up 17.9 percent over the year, the steepest rise since 2022. Gasoline rose 28.4 percent and heating fuel oil more than 50 percent. Beef climbed nearly 15 percent. Shelter, the single largest item in most household budgets, kept rising at 3.3 percent. Meanwhile “core” inflation, the figure central bankers prefer because it strips out food and energy, sat at a far calmer 2.8 percent, which is precisely the number that lets officials say things are under control while you stare at a petrol pump that says otherwise.
The same pattern repeated around the world, which is why this is a global story rather than an American one. The euro area’s rate rose to 3.0 percent in April, with energy swinging from negative to sharply positive and dragging the average up. Across the European Union the spread was enormous, from 0.5 percent in Sweden to 9.5 percent in Romania, a reminder that even within a single monetary bloc the “official” rate is a fiction stretched across wildly different realities. In South Africa, inflation surged to 4.0 percent in April from 3.1 percent the month before, the highest in well over a year and beyond the Reserve Bank’s new 3 percent target, driven by a steep fuel price hike and rising electricity tariffs even as food inflation eased. A South African who drives to work and runs air conditioning lived through an inflation rate that bore little resemblance to the one announced, and the central bank responded by signalling higher interest rates rather than relief.
The lesson of 2026 is structural, not seasonal. When inflation concentrates in non-discretionary, high-variance categories like fuel, electricity and food, the single national average becomes almost useless as a guide to your own finances. The only number that matters is yours.

Build your own: the Personal Inflation Rate method
The method is simple enough that you can do it by hand, and the tool above does it instantly. You list what you actually spend each month across the categories that make up your life, you attach to each the price rise you have genuinely observed over the past year, and you take the spend-weighted average. That is it. It is exactly what a statistics agency does, except the basket is yours and the weights are real rather than assumed.
The tool starts you with a representative household and sensible default price-rise estimates drawn from recent official sub-index readings, but the entire point is to overwrite them. Put in your real rent or mortgage. Put in what your weekly shop genuinely costs now versus a year ago. If you fill your tank twice a week, your fuel line will dominate your result in a way the national average never captures, because fuel is a small slice of the official basket but may be a large, painful slice of yours. Within a minute you will have a single figure that is more honest about your finances than anything a government will ever publish.
What makes the output powerful is not just the headline number but the breakdown beneath it. The tool shows you which categories are actually driving your personal rate, expressed as the share of your total inflation each one contributes. For most people the result is a revelation: a category they considered minor, like fuel or energy, turns out to be responsible for a quarter or more of their entire cost-of-living increase, because a large percentage rise on even a modest spend produces an outsized contribution. Knowing your single biggest inflation driver is the first step to doing something about it, whether that is changing a habit, renegotiating a cost, or hedging the exposure.
What your number actually means: the stand-still hurdle
Once you know your personal inflation rate, you know your hurdle rate, and the hurdle rate is the most important and most ignored number in personal finance. It is the after-tax return your money must earn simply to preserve its purchasing power. Earn less than your personal rate and you are getting poorer in real terms every single year, even as your account balance holds steady or ticks up. The balance is an illusion of stability; the purchasing power is the truth.
This is where most savers are quietly losing. If your personal inflation rate is, say, 4.5 percent and your bank pays you 2 percent, you are losing roughly 2.5 percent of your real wealth a year, guaranteed, while feeling perfectly safe. The tool makes this brutally concrete: it shows you the real yield on your savings after subtracting your personal rate, and it projects how much purchasing power your cash loses over a decade. A basket that costs you a certain amount today will cost dramatically more in ten years, and the cash you are proudly holding will buy a fraction of what it does now. Stability of the number is not safety. It is slow expropriation.

Beating your personal rate: the honest options
If your money must clear your personal inflation rate after tax just to stand still, then the practical question becomes where you can plausibly earn that. This is where the Real Yield Ladder, another Decentralised News instrument, comes in: it ranks every option not by the headline yield it advertises but by what it actually returns after your personal inflation and tax are subtracted. Most “safe” options fail that test in 2026, which is why so much capital is searching for a real return rather than a nominal one.
The candidates fall into a few honest buckets, and none is a free lunch. Cash-like instruments such as money market funds and short-dated government bills now pay meaningful nominal yields, and their tokenized on-chain versions, increasingly available through major exchanges, let you hold that yield in a portable, around-the-clock form. They are the lowest-risk option, but in a high-personal-inflation year they may only get you to break-even. Hard, scarce assets are the traditional hedge against the debasement of money: gold has played this role for millennia, and its tokenized versions trade on most large platforms, while Bitcoin has emerged as the digital contender, prized by its holders precisely because its supply cannot be expanded by any government no matter how large the deficit. The honest caveat is essential and we will not soften it: Bitcoin and other crypto assets are highly volatile and can fall sharply and for extended periods, so while they have outpaced inflation over long horizons they are emphatically not a stable store of value on short ones, and they belong only in a portion of a portfolio sized to a risk you can stomach.
For readers who decide a hard-asset allocation belongs in their plan, the practical entry points are the regulated, liquid exchanges that serve your region. Globally, Binance, OKX, Bybit, MEXC and KuCoin offer the deepest access to Bitcoin, tokenized gold and on-chain treasuries; Kraken is the most broadly regulated option across the US, UK, EU, Canada and Australia, and Bitpanda serves the regulated European market. In Africa, where this publication is based and where 2026’s fuel-driven inflation has bitten hard, VALR and Luno provide the cleanest local-currency on-ramps. Whatever you accumulate as a long-term inflation hedge should not be left sitting on an exchange; move it into self-custody on a hardware wallet such as a Ledger device, because an asset designed to escape one form of counterparty risk should not be exposed to another. And if you simply need to convert between assets without a full exchange account, an instant-swap service like ChangeNOW does the job.
The deeper point is the one the Personal Inflation Rate forces you to confront. You cannot decide whether your savings strategy is working until you know the target it has to beat, and that target is not the government’s number. It is yours.

The bottom line
Inflation is not one number. It is a personal experience that varies with how you live, where you live and what you cannot avoid buying, and in 2026 the gap between the comfortable national average and the uncomfortable individual reality grew wide enough to change financial outcomes. The official rate will keep being announced and markets will keep reacting to it, but you should run your own finances on a truer figure. Build your personal inflation rate with the tool on this page, find your stand-still hurdle, measure whether your savings are actually keeping pace, and size whatever hedges you choose against the real target rather than the official fiction. The number that runs the financial world was never about you. This one is.
Frequently asked questions
What is a personal inflation rate? It is the inflation rate you specifically experience, calculated as the spend-weighted average of the price increases on the things you actually buy. Because your spending pattern differs from the national-average basket the official index assumes, your personal rate is usually different, and in 2026 it is often higher.
Why is my personal inflation rate higher than the official figure? Most commonly because you spend more than the national average on categories that rose fast, such as rent, fuel, energy or food, and less on categories that stayed flat. The official index also assumes you substitute toward cheaper goods and adjusts some price rises for quality improvements, both of which can make the published rate lower than the price increases you actually face.
Is the official inflation rate fake or manipulated? No. It is a legitimate, carefully constructed measure of a representative national basket. The issue is not fraud, it is averaging: a single number for an entire country cannot describe your individual cost of living, especially when inflation is concentrated in unavoidable, high-variance categories like fuel and housing.
How do I calculate my own inflation rate? List your monthly spending by category, note the percentage price rise you have observed in each over the past year, multiply each spend by its rise, add those up and divide by your total spending. The free tool on this page does it instantly and also shows which categories drive your result.
What is a “stand-still hurdle” rate? It is the after-tax return your money must earn just to preserve its purchasing power, which equals your personal inflation rate. If your savings earn less than this, you are losing real wealth every year even though your account balance is not falling.
Why was inflation rising again in 2026? The dominant driver was an energy shock following the conflict with Iran in early 2026, which pushed oil, gasoline and related prices sharply higher across the United States, Europe, South Africa and beyond, lifting headline inflation even where underlying “core” inflation stayed more moderate.
What assets protect against inflation? The traditional answer is scarce hard assets such as gold, alongside inflation-linked and short-dated government bonds for lower-risk savers. Many people now also hold a measured allocation to Bitcoin as a digital hard asset, accepting that it is highly volatile and unsuitable as a short-term store of value. No single asset is guaranteed to beat inflation, and diversification plus appropriate position sizing matters more than any one choice.
Does a higher personal inflation rate mean I should take more risk? Not necessarily. It means you should know your real hurdle rate and make deliberate decisions rather than leave cash to erode by default. The right response might be reducing a major cost, increasing income, or allocating a sensible portion to inflation hedges sized to a risk you can tolerate. This is information for your own decision, not a recommendation, and a qualified financial professional can help you apply it.





