
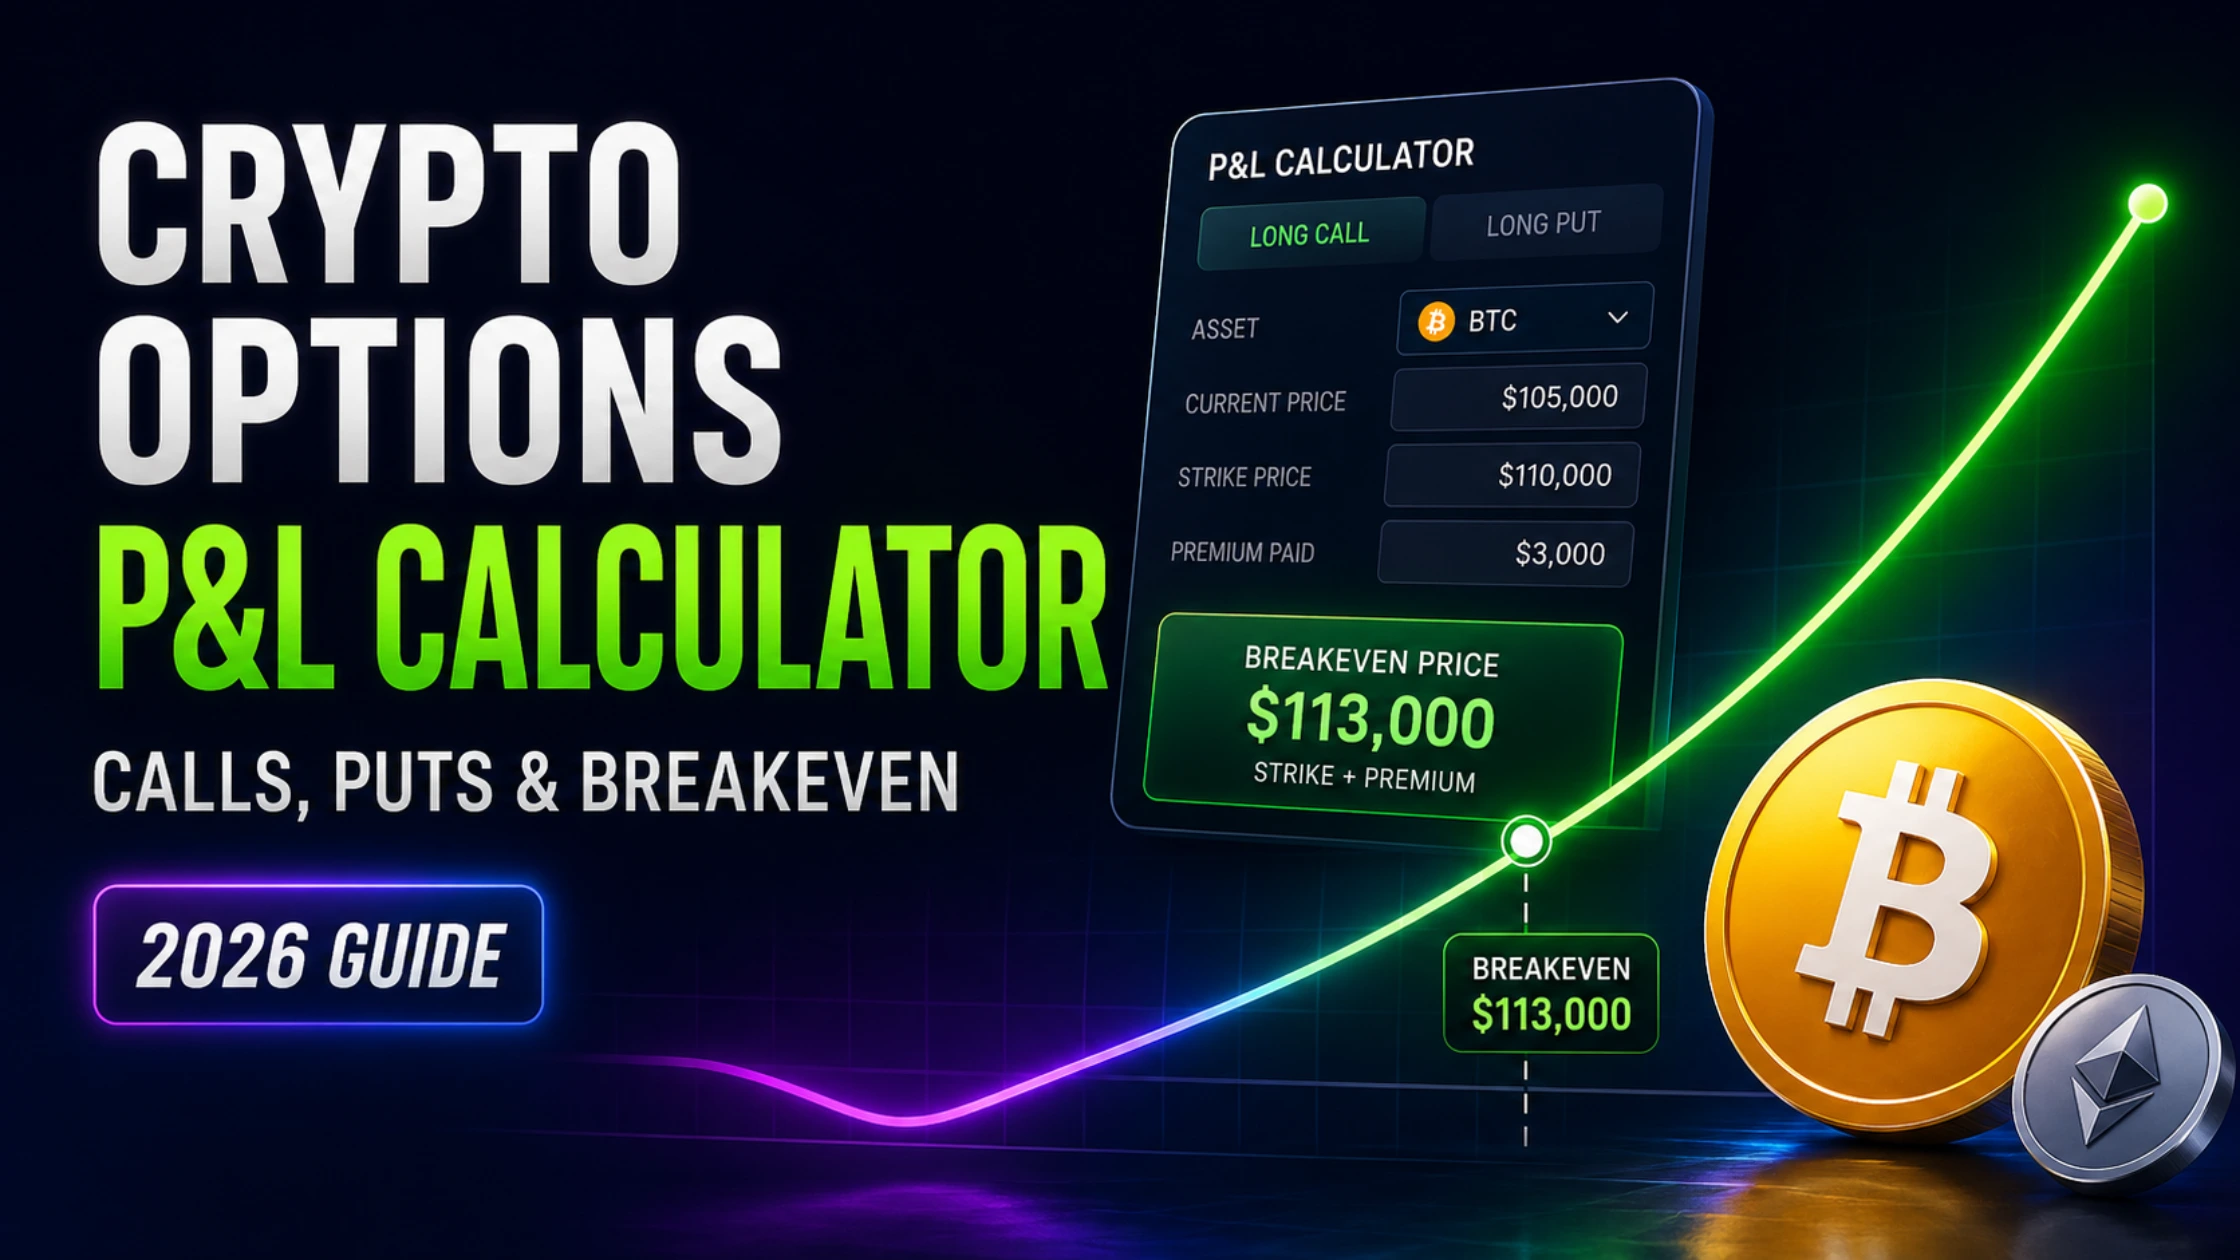
Crypto options let you profit from price moves with limited downside risk. This 2026 guide explains calls, puts, breakeven prices, and the P&L curve that makes everything click — with a live calculator built in.
Crypto Options P&L Calculator 2026 — Calls, Puts, and the Breakeven Price Nobody Explains
A crypto call option gives you the right to buy an asset at a fixed price before a set date. A put option gives you the right to sell. The maximum you can lose on either is the premium you paid upfront — nothing more, regardless of how far the market moves against you. The P&L calculator below shows your exact profit or loss at any price at expiry, including the breakeven price that determines whether your trade makes money at all.
Why Options Exist and Why Most Traders Ignore Them
The crypto derivatives market runs primarily on perpetual futures. Perps are simple: you pick a direction, size your position, manage your liquidation price, and either profit or lose based on which way price moves. The risk profile is symmetric — you can win or lose any amount depending on how far price travels.
Options are structurally different, and that difference is the source of both their appeal and their reputation for complexity.
When you buy an option — either a call or a put — your maximum possible loss is fixed at the moment of entry. You pay a premium, and that premium is the most you can ever lose on that trade. If the market moves violently against you, the option simply expires worthless. Your account does not get liquidated. You do not get margin called. The trade ends with a defined loss you agreed to when you entered.
This asymmetric risk profile — limited downside, unlimited or substantial upside — is why professional traders use options for high-conviction bets and why they are so useful for traders who want directional exposure without liquidation risk. A futures trader who is long BTC at 20× leverage can be wiped out by a 5% adverse move. An options trader who bought a call at the same notional exposure loses nothing more than their premium on the same 5% move.
The reason most crypto retail traders ignore options is not that they are genuinely too complex. It is that the available education almost never includes interactive tools that show you, concretely, what your P&L looks like across the full range of possible outcomes. That is the gap this article and the calculator below are designed to close.

The Four Positions — What Each One Does
Every options position is one of four things. Understanding the difference is the entire conceptual foundation:
Long call: You buy the right to purchase an asset at the strike price before expiry. You profit if the asset rises above the strike plus your premium (the breakeven). Below the breakeven at expiry, the option expires worthless and you lose only the premium. This is the standard bullish options trade.
Long put: You buy the right to sell an asset at the strike price before expiry. You profit if the asset falls below the strike minus your premium. Above the breakeven, the option expires worthless. This is the standard bearish options trade — or a hedge against a long portfolio.
Short call: You sell a call option, collecting the premium upfront. You profit if the asset stays below the strike at expiry — you keep the premium. If the asset rises above the strike, you face unlimited theoretical losses. Short calls are for traders who believe the asset will not rally strongly.
Short put: You sell a put option, collecting the premium. You profit if the asset stays above the strike — you keep the premium. If the asset falls below the strike, you face losses up to the full strike value (if the asset goes to zero). Short puts are a way to collect income while agreeing to buy an asset at a lower price.
For this article, the calculator focuses on long positions — buying calls and puts — because these are the positions most relevant to retail traders building directional strategies with defined risk. Short options require a deeper understanding of risk management and are best approached after mastering the long side.

The Premium — What You Are Actually Paying For
The premium is the price of the option. It is what you pay to enter the trade and the maximum you can lose. Understanding what determines the premium is what separates options traders from option tourists.
Intrinsic value is the portion of the premium that reflects current profitability. A BTC call option with a $100,000 strike when BTC trades at $105,000 has $5,000 of intrinsic value — it is already “in the money” by $5,000. An option with a $120,000 strike when BTC trades at $105,000 has zero intrinsic value — it is “out of the money.”
Time value is the portion of the premium that reflects the probability of the option moving in your favour before expiry. An option with 60 days to expiry commands more time value than an identical option with 7 days remaining because more time means more opportunity for the underlying price to move through the strike. This time value decays as expiry approaches — slowly at first, then rapidly in the final days. This decay is called theta, and it is the primary reason that most out-of-the-money options bought and held to expiry expire worthless.
Implied volatility determines how much time value the market assigns. When the market expects large price swings — around a major event like a Fed decision, a regulatory ruling, or a BTC halving — implied volatility rises and premiums expand. When volatility is expected to be low, premiums compress. Buying options when implied volatility is elevated means paying more for the same directional bet than you would in a calm market.
The Breakeven Calculation
The breakeven price is the single most important number in any options trade. It is the price the underlying asset must reach at expiry for your trade to neither profit nor lose.
For a long call: Breakeven = Strike price + Premium paid per unit
For a long put: Breakeven = Strike price − Premium paid per unit
Example: BTC is trading at $105,000. You buy a call option with a $110,000 strike and pay a $3,500 premium. Your breakeven is $113,500. BTC must trade above $113,500 at expiry for this trade to show a profit. At $113,500 you break even. Above that, every dollar is profit. Below it, the option expires at a loss — maximum loss being the $3,500 premium.
This calculation sounds straightforward, but it has a profound implication: the underlying asset does not just need to move in your direction. It needs to move far enough to clear both the strike price and the premium cost. A call buyer who pays a large premium for a strike already near the money can watch BTC rally 8% and still lose money because the premium implied a larger move was needed to break even.
Use the Calculator
The tool below generates your complete options P&L profile at expiry. Change any input and the curve updates instantly.
Reading the P&L Curve
The visual output of the calculator — the P&L curve — is the chart that makes options intuitively comprehensible in a way that tables of numbers cannot.
For a long call, the curve looks like a hockey stick lying on its side. From left to right as the underlying price rises: the line runs flat along the maximum loss level (the premium paid) from zero up to the strike price. At the strike price it turns upward. At the breakeven it crosses the zero line. Above the breakeven it rises in a straight diagonal line indefinitely — representing unlimited profit potential above that level.
For a long put, the mirror image: the line runs flat at maximum loss from the right side down to the strike. At the strike it turns upward (toward profit) as price falls. It crosses zero at the breakeven and continues rising as price falls toward zero.
The flat portion of the curve represents the premium cost — the amount you have already committed and already lost if the option expires in that price range. The rising portion represents realised value from the option. The crossover point — where the curve crosses zero — is the breakeven price.
What this chart communicates better than any explanation is the concept of maximum loss. However far the price moves against you on the flat portion of the curve, the line does not go further down. The loss is capped. This is structurally different from a futures or perpetual position, where a line on the same chart would continue descending with no floor.

The P&L Table — Ten Prices at a Glance
Below the curve, the calculator outputs a table of P&L values at ten specific price points spanning from deep out-of-the-money to deep in-the-money territory. This table serves a different purpose than the chart: it gives you the precise dollar figure at specific scenarios you want to stress-test.
Before entering any options trade, it is worth asking three specific questions that the table answers directly:
Where is my scenario? If you are bullish on BTC, identify the price target you expect to reach by expiry. Find that price in the table and read the P&L. If the profit is not large enough relative to the premium risk to justify the trade, the options market is pricing your scenario differently than your expectations.
What is the probability-weighted outcome? Most out-of-the-money options expire worthless. The premium reflects the market’s assessment of the probability that the option finishes in the money. A premium of $1,500 on a $10,000 notional option implies approximately 15% odds of profitability — which means 85% of the time this option expires worthless. That is not a reason not to trade — it is a reason to size correctly.
What happens if I am directionally right but early? Options have an expiry date. Being right about the direction but wrong about the timing is a losing trade. If your scenario requires 60 days to play out and you bought a 30-day option, you may be correct about the destination and still lose your entire premium because the option expired before the move materialised.

The Greeks — What You Actually Need to Know
Options textbooks spend extensive time on the Greeks. In practice, retail options traders need to understand three:
Delta is the amount by which your option’s value changes for every $1 move in the underlying. A 0.5 delta call gains approximately $0.50 in value for every $1 BTC rises. Deep out-of-the-money options have low delta (0.10 to 0.20) — they require large moves to generate value. Deep in-the-money options have delta near 1.0 — they move almost dollar for dollar with the underlying. Delta tells you how much directional exposure you have right now.
Theta is the daily decay of time value. Every day that passes without a favourable price move, your option loses a small amount of value — even if the underlying price stays perfectly flat. Theta decay accelerates as expiry approaches. Buying options with 7 or fewer days to expiry means fighting against very rapid time decay unless the move you expect happens immediately.
Vega measures sensitivity to implied volatility. When you buy an option and implied volatility subsequently rises, your option gains value even if the underlying price does not move. When implied volatility collapses — the “IV crush” that often occurs immediately after a widely anticipated event — your option loses value even if the underlying moves in your direction. Buying options before a major event when IV is already elevated is one of the most consistent ways to lose money while being directionally correct.

Where to Trade Crypto Options in 2026
OKX Options is the most comprehensive retail-accessible options platform in 2026. The interface supports European-style options on BTC and ETH, a full Greeks display, an integrated options chain with real-time bid/ask spreads, and a strategy builder for multi-leg positions including spreads and strangles. For a trader learning options, OKX’s interface provides the data density needed to understand what you are trading. For experienced traders, the liquidity on major strikes is institutional-grade.
Bybit Options takes a simpler approach. The interface is cleaner and less data-dense, which makes it more accessible for traders who are new to options and would find OKX’s full options chain overwhelming. Bybit supports BTC and ETH options with weekly and monthly expiries and competitive premiums on major strikes. The simplified interface sacrifices some analytical depth for usability — a reasonable trade-off for traders in their first six months of options trading.
Both platforms offer paper trading modes where you can practice reading options chains and executing trades without risking capital. Using the paper trading account alongside the calculator above — entering a trade in the calculator, then verifying the live premium against the platform’s current ask — is the most effective way to bridge the gap between theory and practice.
Deribit is the institutional benchmark for crypto options. It processes the majority of global crypto options volume, and the Deribit Implied Volatility Index — DVOL — is the standard volatility reference that professional traders and funds use to price options across every other platform. If OKX and Bybit are where retail traders learn options, Deribit is where the market is actually made. The platform supports BTC, ETH, and SOL options with the deepest liquidity, the tightest spreads on major strikes, and a volatility surface tool that shows implied volatility across every strike and expiry simultaneously — something no other platform offers at the same depth. Deribit is best suited to traders who are already comfortable with options mechanics and want to trade at institutional size or access structured strategies beyond basic calls and puts. It was acquired by Coinbase in 2025 for approximately $2.9 billion, which has added regulatory credibility and raised the prospect of US market access in the medium term. The interface is not beginner-friendly, settlements are made in BTC or ETH rather than USD, and the minimum trade size requires more capital than Bybit or OKX to trade meaningfully.
Aevo is the leading on-chain options exchange, built on its own OP Stack Layer 2 and settling in USDC rather than the underlying asset. For traders who want to retain self-custody and avoid centralised exchange counterparty risk, Aevo offers a genuine alternative — options trading with an on-chain order book and transparent settlement without depositing funds to a centralised custodian. The interface is modern and clean, competitive with Bybit for accessibility, and the platform has carved out a distinct position in the crypto-native options space particularly around pre-launch token markets. The honest limitation is liquidity: Aevo’s order book depth on less liquid strikes and assets is thinner than Deribit or OKX, which means wider spreads on everything except the most actively traded BTC and ETH positions. For retail-sized options trades on major strikes, Aevo is a credible option. For large or complex positions, liquidity remains the constraint that pushes professional volume toward Deribit.

A Real Trade Example
BTC is trading at $105,000. You believe it will reach $120,000 before the next monthly options expiry in 28 days. You are considering the following trade on OKX:
- Option type: Long call
- Strike: $110,000
- Premium: $2,800 per BTC
- Contract size: 0.1 BTC
- Contracts: 5 (total notional: $52,500)
What the calculator tells you:
Break-even price: $112,800 (the $110,000 strike plus the $2,800 premium).
Maximum loss: $1,400 (the premium paid across 5 contracts at 0.1 BTC each).
P&L if BTC reaches $120,000 at expiry: ($120,000 − $110,000 − $2,800) × 0.1 × 5 = $3,600 profit.
P&L if BTC reaches $115,000: ($115,000 − $110,000 − $2,800) × 0.1 × 5 = $1,100 profit.
P&L if BTC stays at $105,000 or falls: $0 of option value − $1,400 premium = −$1,400 (maximum loss, regardless of how far BTC falls).
The risk-reward ratio: you risk $1,400 to potentially make $3,600 if BTC hits your target. That is a 2.57:1 reward-to-risk ratio. Whether that ratio is attractive depends on your assessment of the probability that BTC reaches $112,800 within 28 days — which is the analytical question, not the mechanical one the calculator answers.
Plug these exact numbers into the calculator and read the P&L curve. The breakeven, the maximum loss plateau, and the profit ramp will be immediately visible.
FAQ
What is the difference between a call and a put option in crypto? A call option gives you the right to buy an asset at a fixed price (the strike) before the expiry date. You profit if the price rises above the strike plus the premium you paid. A put option gives you the right to sell at the strike price. You profit if the price falls below the strike minus the premium. Both are purchased by paying a premium upfront, which is the maximum you can lose regardless of how far the market moves against you.
What is the breakeven price for a crypto call option? The breakeven price for a long call is the strike price plus the premium paid per unit. If you buy a BTC call with a $110,000 strike and pay a $3,000 premium, your breakeven is $113,000. BTC must trade above $113,000 at expiry for the trade to be profitable. Below that price, the option is worth less than the premium paid.
Can you lose more than the premium on a long options trade? No. When you buy a call or put option (a long position), the maximum possible loss is the premium paid. This is the defining characteristic of long options and what distinguishes them from futures or perpetual contracts, where losses are unlimited in both directions.
What is implied volatility and why does it affect crypto options pricing? Implied volatility is the market’s expectation of how much the underlying asset will move before the option’s expiry. Higher expected volatility means higher premiums because there is a greater chance the option will move significantly into profitable territory. Buying options when implied volatility is elevated — such as immediately before a major macro event or anticipated news — means paying a premium that may collapse after the event even if the price moves in your direction.
What crypto options platforms are best for beginners in 2026? Bybit Options offers the cleanest, most accessible interface for traders new to options. OKX Options provides more analytical depth including a full options chain with Greeks, better suited for traders who want to progress beyond basic calls and puts into more structured strategies. Both support paper trading accounts for practice before committing real capital.
How is a crypto options P&L calculated at expiry? For a long call: P&L = (max(spot price − strike price, 0) × contract size × number of contracts) − total premium paid. For a long put: P&L = (max(strike price − spot price, 0) × contract size × number of contracts) − total premium paid. If the option expires out of the money (spot below strike for a call, above strike for a put), the P&L equals the total premium paid as a loss.
Trade crypto options: OKX Options — full options chain with Greeks and multi-leg strategies | Bybit Options — simplified interface for new options traders
Recommended reading:
Deribit Options Strategy in 2026: The Institutional Playbook for Crypto Traders
Top 10 On-Chain Derivatives Tokens in 2026: Trade Perpetuals, Options & Leverage on DeFi
The Global Exchange Matrix (2026): Where Smart Money Trades Crypto, Futures & Options
Crypto Structured Products in 2026: Autocallables, Range Accrual, and Options-Driven Yield Explained





