
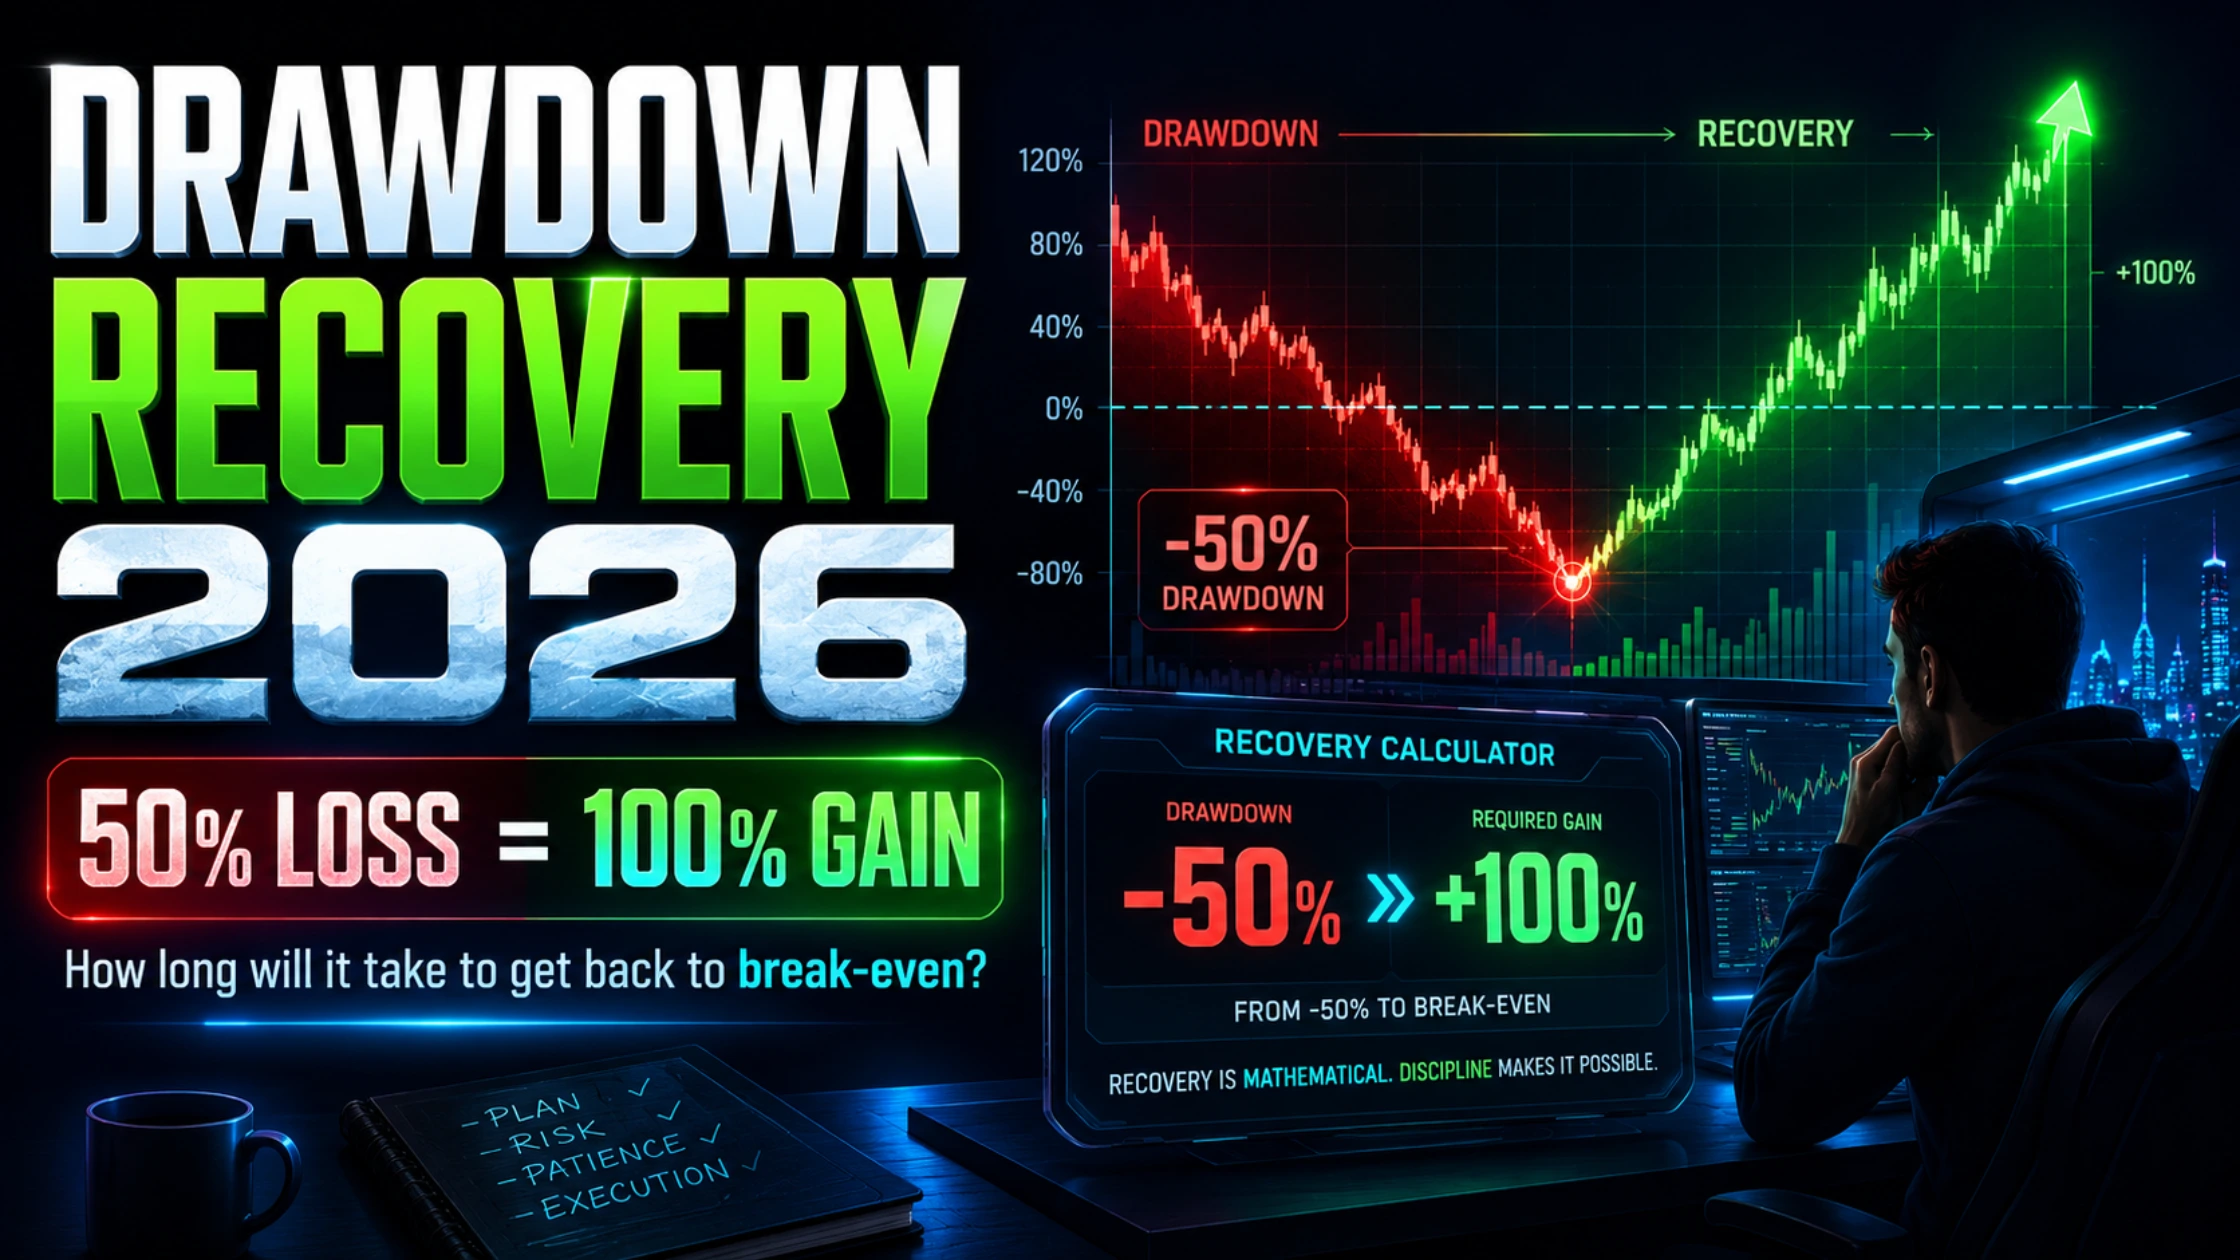
A 50% loss requires a 100% gain to recover. Use this drawdown recovery calculator to see exactly how long your crypto account needs to get back to even — and what monthly return rate changes everything.
A 30% crypto drawdown requires a 42.9% gain to recover. A 50% loss requires a 100% gain. A 70% loss requires a 233% gain. The recovery calculator below shows exactly how many months it takes to get back to your previous account high under three realistic return scenarios — and why that number is almost always longer than your instincts suggest.
The Number Every Trader Gets Wrong
Ask a trader who just lost 40% of their account how much they need to make back to break even. Most will say 40%. The correct answer is 66.7%.
This is the asymmetry of losses — one of the most important and least understood concepts in trading. Because the loss and the recovery are calculated from different base amounts, they are never equal. You lose 40% of $100,000, leaving you with $60,000. To get back to $100,000 from $60,000 you need to grow by $40,000 — which is 66.7% of your new, smaller base.
The asymmetry compounds sharply as the drawdown deepens. Here is what the math actually looks like:
|
Drawdown suffered |
Gain required to recover |
|
10% |
11.1% |
|
20% |
25.0% |
|
30% |
42.9% |
|
40% |
66.7% |
|
50% |
100.0% |
|
60% |
150.0% |
|
70% |
233.3% |
|
80% |
400.0% |
|
90% |
900.0% |
Sitting with that table for a moment is worthwhile. The traders who survived crypto’s 2022 bear market — when portfolios fell 70, 80, even 90% from peak — were not just waiting for prices to recover. They needed assets to return 233%, 400%, and 900% respectively just to get back to where they started. Many are still waiting.
This is not meant to be discouraging. It is meant to be clarifying. Understanding the math of drawdowns is the first step toward making rational decisions about what to do next.

Why Your Instincts About Recovery Time Are Wrong
The human brain is not built for compound growth mathematics. When asked how long it will take to recover a 50% loss at a consistent 5% monthly return, most traders guess somewhere between 10 and 15 months. The correct answer is just over 14 months — which is on the high end of most intuitive estimates, but still achievable. When asked the same question about a 5% loss at 2% monthly, most traders say 3 months. The correct answer is 2.5 months. Those are not far off.
The errors become severe at the extremes. A trader who lost 80% of their account and expects to recover at 10% monthly will need to generate a 400% gain — and even at 10% monthly compounding, that takes 16.7 months. Most traders, facing an 80% loss, overestimate both the speed at which they can generate 10% monthly returns and the probability of sustaining that rate without a further drawdown along the way.
This is where the recovery calculator below is genuinely useful. It does not tell you what will happen. It tells you what the math requires — and then you can decide whether your assumptions about your own future returns are realistic.
The Three Recovery Scenarios
The calculator uses three monthly return assumptions that bracket the realistic range for an active crypto trader in 2026:
Conservative — 2% per month (26.8% annualised): This is achievable through a combination of passive strategies — liquid staking on ETH via Lido, stablecoin yield from Ondo USDY, and a grid bot running on a stable pair. It requires almost no active trading decisions and carries low additional risk during the recovery period. The drawback is that recovery takes longer. The advantage is that the probability of suffering another significant drawdown on the way to recovery is low.
Moderate — 5% per month (79.6% annualised): This requires active but disciplined trading — systematic strategies, controlled leverage, strict position sizing. It is achievable for experienced traders in favourable market conditions but is not guaranteed in any given month. Treating 5% monthly as a steady state assumption over 12 or more months is optimistic. Use this scenario as a mid-case, not a base case.
Aggressive — 10% per month (213.8% annualised): This is a high-leverage, high-frequency trading assumption that most retail traders cannot sustain without exposing themselves to the risk of a second drawdown that resets the recovery clock entirely. The 10% scenario is included not because it is recommended but because it shows how even aggressive trading cannot escape the mathematics of a large drawdown as quickly as most traders want to believe.
Use the Recovery Calculator
Enter your account value before the loss, the drawdown you suffered, and the calculator projects your recovery timeline under all three scenarios simultaneously.
What the Chart Is Actually Telling You
The three recovery curves reveal something that numbers in a table cannot: the relationship between return rate and recovery time is not linear. Doubling your monthly return does not halve your recovery time — it reduces it by significantly more. Going from 2% to 5% monthly does not reduce recovery time by 60%. It reduces it by significantly more than that because compounding accelerates as the account grows back toward the target.
This means the highest-leverage intervention in a drawdown recovery is not grinding out slightly better trades. It is making strategic decisions about where to deploy capital for the highest sustainable return — with emphasis on sustainable.
The other thing the chart shows is where the three curves diverge most dramatically: in the early months. The difference between a 2% and 5% monthly return is barely visible at month one. By month six it is significant. By month twelve it is often the difference between being recovered and being halfway there. This is the compounding effect in reverse — just as compounding wealth takes time to accelerate, compounding a recovery also requires patience before the mathematics start working meaningfully in your favour.
The Psychological Trap That Kills Recovery Accounts
There is a pattern that repeats across nearly every significant trading drawdown, regardless of the trader’s experience level. It runs like this:
The loss happens. The trader feels the acute pain of seeing their account reduced. They tell themselves they will recover it quickly by trading more aggressively than before — taking larger positions, higher leverage, more frequent trades. They have something to prove, to themselves if nobody else. The need to recover fast overrides the rational analysis of risk.
What this approach almost always produces is a second drawdown. The aggressive trading that was supposed to accelerate recovery instead accelerates the loss. The account, already reduced from the first drawdown, shrinks further. The required gain to recover has now compounded dramatically.
The trader who loses 50% and then, in the process of trying to recover aggressively, loses another 30% of their remaining account is now sitting on a 65% total drawdown. They need a 185% gain just to get back to their original starting point — from a much smaller base, with less psychological resilience than when they started.
The research on trading psychology calls this the “break-even effect” — the empirically documented tendency of traders who have suffered losses to take on more risk, not less, because the desire to return to break-even overrides rational risk assessment. The recovery calculator exists partly to counteract this: to show, concretely, that the conservative path and the aggressive path often arrive at recovery within months of each other, while the conservative path carries dramatically lower risk of a second significant drawdown along the way.
How to Actually Accelerate Recovery
Given everything above, here is the honest framework for approaching a drawdown recovery period:
First, stop trading for a fixed period. This sounds counterintuitive but is the most important step. Seven to fourteen days completely away from your trading account allows the acute emotional response to a loss to subside enough that your subsequent decisions are rational rather than reactive. The market will still be there. The opportunities will still be there. Your judgment will be significantly better after a cooling-off period.
Second, identify what caused the drawdown and whether it was systematic or circumstantial. A drawdown caused by a single high-conviction trade that went wrong is different from a drawdown caused by a systematic flaw in your approach — over-leveraging, not using stop losses, trading assets beyond your knowledge base. The second type requires structural changes before you resume. The first type may not.
Third, deploy remaining capital conservatively during recovery. The priority during a drawdown recovery period is preserving what remains, not recovering quickly. On BloFin, use isolated margin for every position — this guarantees that a second bad trade cannot cascade into your entire remaining account. On TradingView, build a written trading plan before every session: maximum loss per trade, maximum daily loss, the specific conditions under which you will add to a position versus cut it.
Fourth, supplement active trading with passive yield. Running a DCA bot on Bybit Auto-Invest, earning liquid staking rewards on your ETH allocation, or holding idle stablecoin capital in Ondo’s USDY rather than leaving it dormant all contribute to recovery without requiring trading decisions. Every 0.3% per month generated passively reduces the active return rate required from your trading.
Fifth, consult the recovery chart before every significant position. The calculator is not just a one-time tool. It is useful as a regular reference during the recovery period. Before taking a large leveraged position, ask: if this trade goes against me by 20%, how does that change my recovery timeline? The calculator answers that question in seconds. Seeing the recovery curve shift dramatically on the chart from a single bad trade is a powerful reinforcement of position sizing discipline.
The Tax Angle You Are Probably Missing
One element of drawdown recovery that most traders ignore entirely is tax loss harvesting. In many jurisdictions — including the UK, South Africa, and several others where Decentralised News readers are based — realised losses on crypto assets can be used to offset capital gains elsewhere in your portfolio.
If you suffered a significant drawdown and realised those losses by selling, those losses may reduce your tax liability on profitable trades made earlier in the same tax year. Depending on your jurisdiction and the scale of your loss, this could represent a meaningful recovery of capital through the tax system rather than through trading performance.
Koinly automates the identification of harvestable losses across your entire crypto transaction history. It connects to exchanges and wallets, calculates your realised gains and losses by jurisdiction, and identifies the most efficient loss-harvesting opportunities remaining before the end of the tax year. In a year where you have suffered a significant drawdown, this is not an optional administrative task. It is a financial intervention that can return real capital to your account.
The process takes less than an hour to set up and the difference in tax liability for a trader who has realised significant losses can be substantial — potentially thousands of dollars returned through the tax system that can be redeployed into the recovery strategy.
When the Calculator’s Output Means You Should Do Something Different
There is a scenario where the calculator’s output should prompt a fundamentally different decision rather than a refined recovery plan. When the drawdown is severe enough — 70%, 80%, or more — and the realistic recovery timeline under even moderate assumptions runs to three or more years, the honest question is whether active trading is the right recovery vehicle at all.
A trader with $20,000 remaining from a peak of $100,000 who projects a 5% monthly return will recover in approximately 38 months — over three years. During those three years, they need to generate those returns without suffering another significant drawdown. That is a demanding requirement.
The alternative worth considering is stepping back from active trading entirely, deploying the remaining capital into the highest-risk-adjusted passive yield available — liquid staking, tokenised Treasury yield, structured stablecoin products — and allowing time and compound interest to do the work that aggressive trading will be tempted to do more quickly but with much greater risk.
The calculator does not make this decision for you. But it gives you the numbers that should inform it. FAQWhy does a 50% loss require a 100% gain to recover? Because the gain percentage is calculated from a smaller base. If you lose 50% of $100,000 you have $50,000 remaining. To return to $100,000 from a $50,000 base, you need to gain $50,000 — which is 100% of your remaining $50,000. The loss and recovery percentages use different starting points, so they are never equal for any drawdown greater than zero.
What is a realistic monthly return assumption for crypto recovery? For a disciplined active trader in favourable market conditions, 3 to 5% monthly is achievable but not guaranteed in any specific month. Over a multi-month recovery period, the conservative 2% monthly scenario is the most prudent base case because it can be supplemented with passive yield strategies and carries lower additional drawdown risk. Assuming 10% monthly sustained over a recovery period is almost always overoptimistic.
Should I trade more aggressively after a large drawdown to recover faster? No. This is the most common and most damaging response to a drawdown. Increasing leverage and risk after a loss compresses your margin for error at precisely the moment your psychological state is least suited to high-risk decision-making. The probability of a second significant drawdown — which resets and deepens the recovery challenge — is higher during the emotional aftermath of a loss. Reduce position sizes during recovery, not increase them.
What is tax loss harvesting and how does it apply to crypto drawdowns? Tax loss harvesting is the practice of realising investment losses to offset gains in the same tax period, reducing your overall tax liability. If you suffered a crypto drawdown and sold positions at a loss, those realised losses can offset profits from other crypto trades made earlier in the tax year. The net effect is a reduction in your tax bill — which returns real capital to your account without requiring trading performance.
How do I avoid a repeat drawdown during the recovery period? The most effective structural changes are: using isolated margin for every leveraged trade so a single bad position cannot cascade through your account, setting a maximum daily loss limit below which you stop trading for the day, reducing position sizes to no more than 2% of account per trade during recovery, and using TradingView’s alert system to monitor positions without needing to watch charts continuously.
Risk management tools for the recovery phase: BloFin — isolated margin and risk controls for every position | TradingView — build and follow a written trading plan | Koinly — identify and harvest tax losses to recover capital through your tax return.
Recommended reading:
Crypto Perpetuals: Price Impact, Liquidation Traps & Smart Entry Points
Predicting Liquidation Cascades Using AI
The Hidden Edge: Trading Liquidations Instead of Indicators
Liquidation Heatmaps: How to Predict Cascades Hours Before They Happen
The Liquidation Trap: How Exchanges Hunt Your Stops (And How to Escape)





