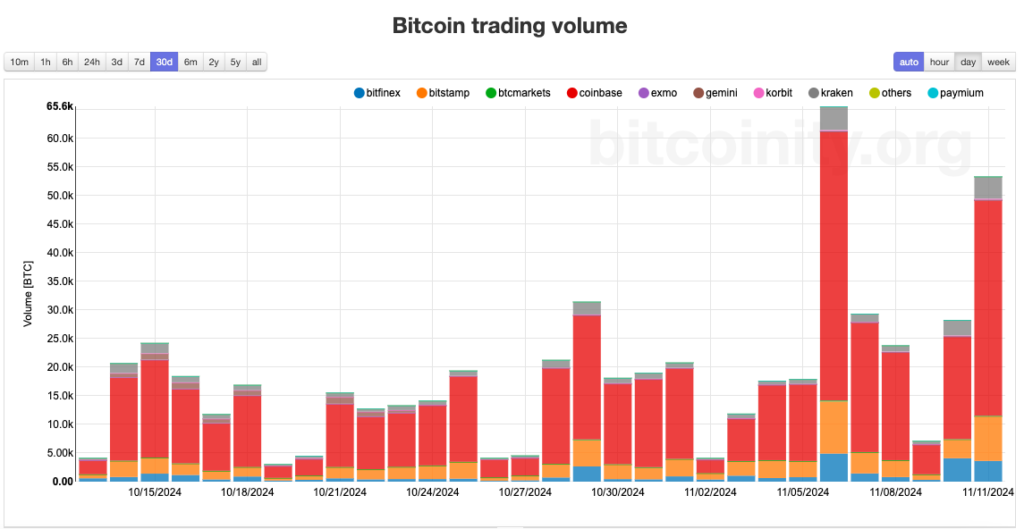
Bitcoin Hits New All-Time High: M2 Money Supply and Crypto Market Cycles
M2 Money Supply and Bitcoin’s Market Cycles.
The resurgence in M2 money supply and Bitcoin’s recent rally past $89,000 underscore the deep ties between economic policy, liquidity, and asset prices. Today, Bitcoin’s market cap alone exceeds $1.77 trillion, surpassing even Spain’s GDP, highlighting the growing relevance of digital assets in the global economy.
For sophisticated market analysts, the current economic and crypto landscape demands a nuanced understanding of how M2, a core indicator of money supply, impacts market cycles and sets the stage for potentially massive gains. The M2 money supply – representing cash, checking deposits, savings, and other easily accessible forms of money – is a crucial indicator in understanding economic liquidity and its impact on markets. While M2 doesn’t include larger institutional deposits, it provides a snapshot of available capital in the economy, which influences asset prices, including Bitcoin. Historically, growth in M2 has correlated with Bitcoin’s bull cycles, offering a powerful predictor for strategic investors.
Understanding M2 and Its Role in Market Liquidity
Central banks like the Federal Reserve manipulate M2 through interest rate policies and quantitative easing, especially during economic downturns. Increasing M2 aims to boost spending and investment, whereas curbing its growth can rein in inflation. When M2 rises, investors often turn to assets that hedge against inflation, like Bitcoin, which benefits from increased liquidity.
For investors, the pace of M2 growth is more telling than its absolute value. Accelerated M2 growth tends to be a favorable environment for risk assets like Bitcoin, as it signals higher liquidity in the economy. Conversely, contractions in M2 often signal caution and potential downward pressure on Bitcoin.
A Historical Context: M2, Market Cycles, and Bitcoin’s Trajectory
- 2014-2015: M2’s contraction correlated with a Bitcoin bear market, as tighter liquidity reduced demand for riskier assets.
- 2020-2021: During the pandemic, aggressive monetary easing resulted in unprecedented M2 growth, sparking one of Bitcoin’s largest bull runs. Investors turned to Bitcoin as a hedge against currency devaluation due to this “money printing” phase.
- 2023-2024: A stabilizing M2 coincided with Bitcoin’s consolidation. With potential rate cuts on the horizon, more liquidity was waiting to enter the system, setting the stage for another bullish phase.
With further rate cuts, new liquidity could flood the market. If the US Fed continues to reduce rates, more capital may flow into assets like Bitcoin, further driving demand as traditional investments yield lower returns.
Bitcoin’s Unique Position in This Market Cycle
While M2 has historically influenced Bitcoin’s price, today’s cycle is distinct due to global adoption and institutional interest. Major institutional players like ETFs, MicroStrategy, and various funds are accumulating Bitcoin at significant rates. Over 73% of Bitcoin’s supply is now held in illiquid wallets, reducing the active trading supply and mirroring the dynamics of previous bull runs.
Furthermore, central banks globally, including those in China and the EU, are contributing to M2 growth, creating opportunities for risk assets across borders. Monitoring M2 in various economies helps investors anticipate Bitcoin’s broader market cycles.
For investors, M2 trends offer valuable cues for timing market entries and exits:
- Using M2 as a Risk-On Indicator: Accelerated M2 growth suggests a favorable climate for risk assets like Bitcoin, enabling strategic entry points.
- Watching for Institutional Accumulation: Bitcoin’s growing reputation as a hedge has spurred institutional demand. Monitoring large-scale transactions and on-chain data reveals accumulation patterns and potential supply crunches.
- Following Global Liquidity Trends: Tracking M2 growth in major economies – particularly the U.S., China, and the Eurozone – provides a global view of liquidity cycles and the resulting impact on Bitcoin demand.

The Road to $100,000 Bitcoin?
The current rally points to a significant transformation in the crypto market’s size and impact. While some warn of short-term corrections and potential leverage washouts, the foundational trend remains robust. Bitcoin’s trajectory toward $100,000, coupled with an expanding crypto market cap, suggests a maturing asset class increasingly woven into the global economic fabric.
Whether driven by M2 expansion, institutional inflows, or global adoption, the crypto market is poised for new highs. For those prepared to capitalize on this evolution, the M2 metric serves as an invaluable compass, pointing the way in a landscape where liquidity, policy, and innovative finance converge. By aligning with M2 trends and staying alert to broader market shifts, investors can harness the power of a booming market, perhaps transforming volatility into opportunity as Bitcoin and its digital peers redefine the future of finance.


